
May 2026 continued the trend of moderating electricity prices across the National Electricity Market, supported by improving supply conditions and ongoing growth in renewable generation. Key developments during the month included:
• NEM spot prices fell 17.9% year-on-year, with New South Wales recording the largest reduction across the mainland states.
• Renewable generation increased to 39.4% of total supply, driven by a strong uplift in wind generation.
• Battery discharge more than tripled compared with May 2025, highlighting the growing contribution of storage to market flexibility.
• Forward electricity prices declined across most regions, with NSW, Queensland and South Australia now trading materially below long-term averages.
These outcomes reflect the continued evolution of the electricity market as renewable and storage capacity expands across the NEM. While spot and futures markets both softened during May, regional differences remain evident as each state responds to its unique supply, demand and generation mix dynamics.
National Electricity Update
Spot Prices
Spot prices across the National Electricity Market (NEM) were lower in May 2026 compared with May 2025, with all regions recording year-on-year declines. NSW recorded the largest reduction at -33.3%, while SA and TAS proved more resilient, each down 7.0%. The NEM average fell by 17.9% year-on-year to $79.35/MWh.
Current spot prices sit below rolling 12-month averages across all mainland regions, with NSW the most pronounced — May 2026 pricing was approximately 12% below its 12-month average of $92.82/MWh, indicating a meaningful step down from the elevated conditions experienced through mid-2025.
| Region | May-25 ($/MWh) | May-26 ($/MWh) | % Movement | 12M Avg ($/MWh) |
|---|---|---|---|---|
| NSW | 123.02 | 82.01 | -33.3% | 92.82 |
| QLD | 95.63 | 76.34 | -20.2% | 73.64 |
| SA | 83.31 | 77.49 | -7.0% | 88.50 |
| TAS | 103.39 | 96.14 | -7.0% | N/A |
| VIC | 78.05 | 64.77 | -17.0% | 69.33 |
| NEM Avg | 96.68 | 79.35 | -17.9% | 81.07 |
Futures Prices
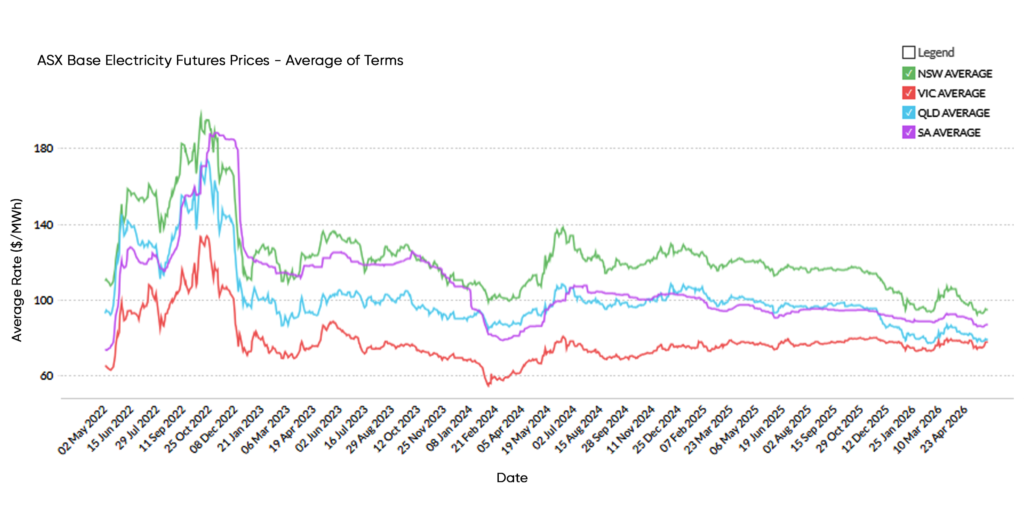
Forward prices softened across most regions during May, continuing the downward trend observed since the March peak. All states declined in absolute terms, with the average of forward contracts now sitting well below long-term averages in NSW, QLD and SA.
NSW forward prices closed the month at $94.77/MWh — the lowest monthly close since February 2022, reflecting sustained market repricing as supply conditions improve. QLD and SA show a similar pattern, both tracking 13-17% below their long-term averages. Victoria remains the exception, trading slightly above its long-term average of $74.56/MWh, underpinned by its structurally tighter supply profile.
| Region | Month Open | Month Close | % Movement | LT Avg (Jan 23) | vs LT Avg |
| NSW | 98.54 | 94.77 | -3.8% | 115.94 | -18.3% |
| QLD | 82.05 | 79.14 | -3.5% | 95.12 | -16.8% |
| SA | 89.92 | 86.93 | -3.3% | 100.38 | -13.4% |
| VIC | 78.53 | 77.82 | +0.9% | 74.56 | +4.4% |
| NEM (Avg) | 87.26 | 84.67 | -3.1% | 96.50 | -12.2% |
Generation Mix
Total NEM generation was broadly flat year-on-year at 17,715 GWh. The most notable shift was a strong increase in wind output (+15.5%), which drove the renewable share to 39.4% — a new high for May. Solar generation edged slightly lower (-3.6%), partially offset by the wind uplift.
Battery discharge tripled year-on-year to 356 GWh, consistent with the rapid growth in dispatchable storage capacity across the NEM. Curtailment fell modestly for both solar and wind, a positive signal against a backdrop of rising renewables penetration. Coal and gas generation both declined, with emissions intensity improving by 2.9%.
| Metric | May-25 | May-26 | Change |
|---|---|---|---|
| Total generation (GWh) | 17,704 | 17,715 | +0.1% |
| Renewable share (%) | 37.6% | 39.4% | +1.8 % |
| Coal share (%) | 57.3% | 55.8% | -1.5 % |
| Gas share (%) | 5.5% | 4.5% | -1.0% |
| Wind (GWh) | 2,615 | 3,020 | +15.5% |
| Solar (GWh) | 2,899 | 2,796 | -3.6% |
| Battery discharge (GWh) | 114 | 356 | +212% |
| Solar Curtailment (GWh) | 96 | 80 | -16.7% |
| Wind curtailment (GWh) | 199 | 185 | -7.0% |
| Emissions intensity (kgCO₂e/MWh) | 588 | 571 | -2.9% |
State Electricity Update
New South Wales
Spot
NSW average spot prices declined to $82.01/MWh, down from $123.02/MWh in May 2025 (-33.3%). This was the largest year-on-year reduction across the mainland states. The May 2026 outcome sits below the 12-month average of $92.82/MWh, reflecting continued normalisation following the elevated pricing environment of mid-2025.
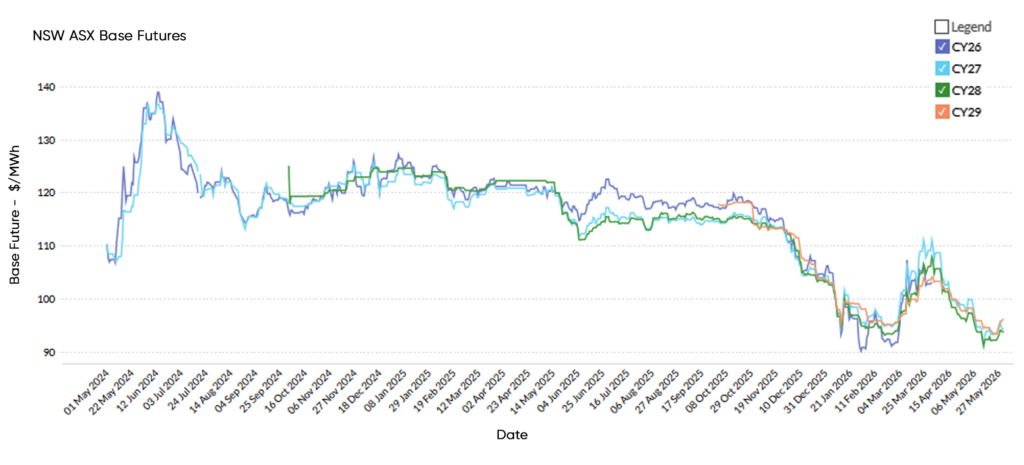
Futures
| Contract | Month Open | Month Close | % Change |
|---|---|---|---|
| CY27 | 100.03 | 94.34 | -5.7% |
| CY28 | 97.41 | 93.79 | -3.7% |
| CY29 | 98.35 | 96.18 | -2.2% |
Forward prices declined across all contracts during May, with CY27 seeing the sharpest fall (-5.7%). The forward curve now sits consistently below the $100/MWh level, with the broader repricing reflecting growing confidence in NSW supply conditions as coal retires are offset by new renewable and storage capacity.
Generation Mix
| Metric | May-25 | May-26 | Change |
|---|---|---|---|
| Total generation (GWh) | 6,286 | 6,218 | -1.1% |
| Renewable share (%) | 31.0% | 30.7% | -0.3% |
| Coal (GWh) | 3,831 | 3,786 | -1.2% |
| Gas (GWh) | 178 | 71 | -60.1% |
| Imports (GWh) | 499 | 565 | +13.2% |
| Battery discharge (GWh) | 19.7 | 19 | -3.6% |
| Emissions intensity (kgCO₂e/MWh) | 605 | 606 | +0.2% |
Total NSW generation was slightly lower YoY at 6,218 GWh. The standout shift was a sharp reduction in gas generation (-60.1%), with imports rising to partially compensate. Renewable share was broadly flat at 30.7%, with solar and wind output largely unchanged. Emissions intensity was essentially flat at 606 kgCO₂e/MWh.
Queensland
Spot
QLD average spot prices fell to $76.34/MWh, down from $95.63/MWh (-20.2%). At $76.34/MWh, May spot pricing sat marginally above the 12-month average of $73.64/MWh — the narrowest gap of any mainland state, suggesting QLD pricing has been broadly range-bound over the past year.
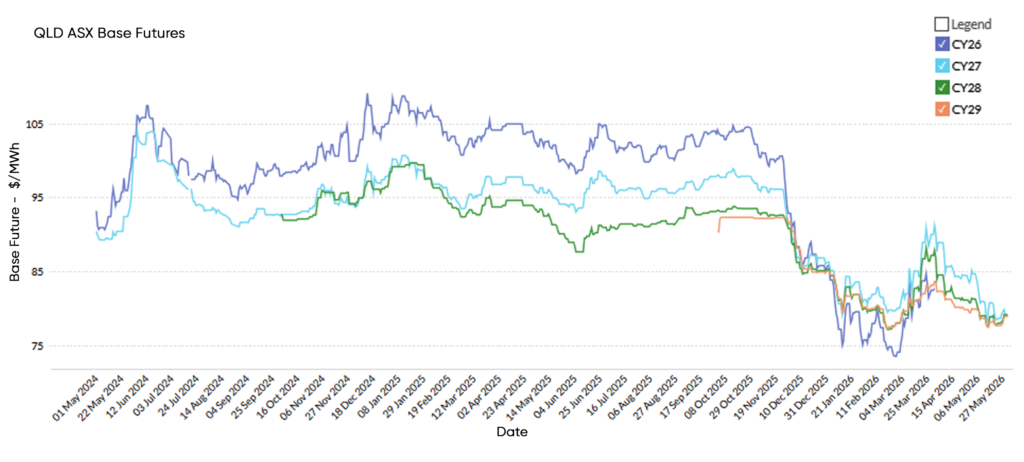
Futures
| Contract | Month Open | Month Close | % Change |
|---|---|---|---|
| CY27 | 85.21 | 79.15 | -7.1% |
| CY28 | 81.48 | 79.25 | -2.7% |
| CY29 | 80.08 | 79.01 | -1.3% |
Forward prices declined across all contracts, with CY27 the most affected (-7.1%). The QLD curve is now effectively flat across CY27-CY29 in the $79/MWh range, suggesting the market sees limited price escalation risk over the medium term — supported by strong renewable growth and the continued rollout of battery and pumped hydro capacity.
Generation Mix
| Metric | May-25 | May-26 | Change |
|---|---|---|---|
| Total generation (GWh) | 5,045 | 5,065 | +0.4% |
| Renewable share (%) | 29.5% | 35.4% | -5.9% |
| Coal (GWh) | 3,485 | 3,209 | -7.9% |
| Gas (GWh) | 358 | 309 | -13.7% |
| Wind (GWh) | 346 | 625 | +80.6% |
| Solar (GWh) | 1,030 | 1,198 | +16.3% |
| Battery discharge (GWh) | 30 | 125 | +316.7% |
| Emissions intensity (kgCO₂e/MWh) | 634 | 567 | -10.6% |
QLD saw a significant shift in its generation mix, with wind output nearly doubling year-on-year (+80.6%) and solar growing by 16.3%. Combined, this drove the renewable share from 29.5% to 35.4% — a substantial 5.9 percentage point improvement. Coal generation declined by 7.9% and gas fell 13.7%, with battery discharge up over fourfold. Emissions intensity fell sharply by 10.6% to 567 kgCO₂e/MWh.
Victoria
Spot
VIC average spot prices fell to $64.77/MWh, down from $78.05/MWh (-17.0%). The 12-month rolling average of $69.33/MWh sits slightly above the May 2026 outcome, suggesting some recent softening. VIC continues to record the lowest absolute spot prices of any mainland state.
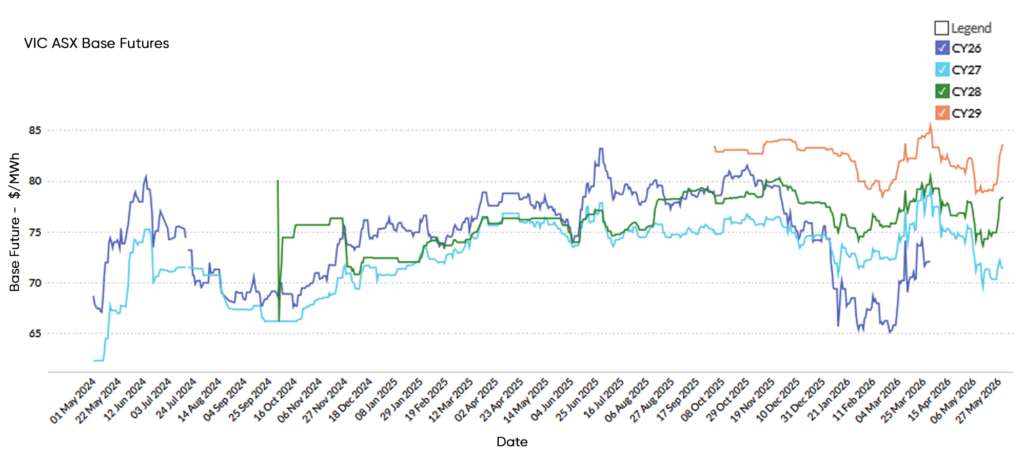
Futures
| Contract | Month Open | Month Close | % Change |
|---|---|---|---|
| CY27 | 75.62 | 71.48 | -5.5% |
| CY28 | 78.04 | 78.40 | +0.5% |
| CY29 | 82.05 | 83.57 | +1.9% |
VIC forward prices presented a mixed picture in May: CY27 declined by 5.5%, while CY28 (+0.5%) and CY29 (+1.9%) edged higher. This creates a modest upward slope in the outer years, distinguishing VIC from the broadly flat-to-declining curves of other states. VIC remains the only region trading above its long-term average, reflecting its structurally tight supply position as brown coal retires and new renewable capacity ramps up.
Generation Mix
| Metric | May-25 | May-26 | Change |
|---|---|---|---|
| Total generation (GWh) | 4,239 | 4,356 | +2.8% |
| Renewable share (%) | 40.9% | 39.8% | -1.1% |
| Coal (GWh) | 2,821 | 2,986 | +5.8% |
| Gas (GWh) | 100 | 107 | +7.0% |
| Wind (GWh) | 938 | 1,080 | +15.1% |
| Solar (GWh) | 515 | 408 | -20.8% |
| Battery discharge (GWh) | 37 | 83 | +124.3% |
| Emissions intensity (kgCO₂e/MWh) | 707 | 726 | +2.7% |
VIC total generation rose 2.8% to 4,356 GWh. Wind output increased strongly (+15.1%), though coal generation also rose (+5.8%), partly explaining the slight increase in emissions intensity to 726 kgCO₂e/MWh — the only state to record higher emissions year-on-year. Battery discharge more than doubled, and VIC shifted from a net importer to a net exporter during the month.
South Australia
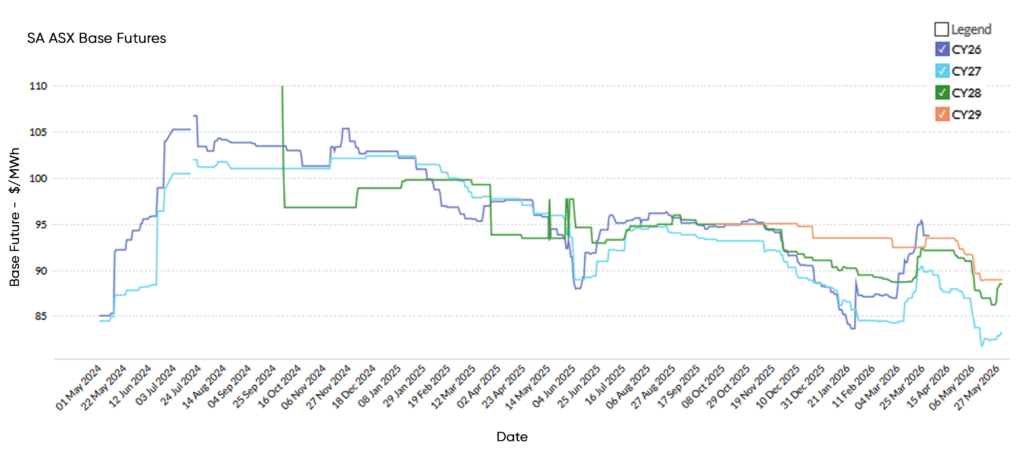
Spot
SA average spot prices declined to $77.49/MWh, down from $83.31/MWh (-7.0%). This was among the more modest declines across the NEM, reflecting SA’s already-competitive pricing structure. The result sits below the 12-month average of $88.50/MWh, consistent with the broader softening trend.
Futures
| Contract | Month Open | Month Close | % Change |
|---|---|---|---|
| CY27 | 87.00 | 83.23 | -4.3% |
| CY28 | 91.02 | 88.54 | -2.7% |
| CY29 | 91.74 | 89.00 | -3.0% |
SA forward prices eased across all contracts, with CY27 seeing the largest move (-4.3%). The SA curve remains relatively stable in the $83-89/MWh range across CY27-CY29, reflecting the state’s high renewable penetration and ongoing reliance on gas and interconnector flows to manage supply variability. SA forward prices closed May 2026 at levels last seen in April 2024.
Generation Mix
| Metric | May-25 | May-26 | Change |
|---|---|---|---|
| Total generation (GWh) | 1,221 | 1,187 | -2.8% |
| Renewable share (%) | 65.8% | 62.1% | -3.7% |
| Gas (GWh) | 327 | 304 | -7.0% |
| Wind (GWh) | 546 | 575 | +5.3% |
| Solar (GWh) | 279 | 192 | -31.2% |
| Imports (GWh) | 101 | 163 | +61.4% |
| Battery discharge (GWh) | 27 | 37 | +37.0% |
| Emissions intensity (kgCO₂e/MWh) | 227 | 240 | +5.7% |
SA total generation declined slightly (-2.8%) to 1,187 GWh. Wind remained the dominant source at 46.5% of generation, though solar fell sharply (-31.2%), contributing to a 3.7 percentage point decline in the renewable share to 62.1%. Gas remained elevated and imports rose significantly (+61.4%), filling the gap left by lower solar. Emissions intensity ticked up modestly to 240 kgCO₂e/MWh.
Closing Commentary
May reinforced the broader trend of improving supply conditions across the National Electricity Market. Increased renewable generation, growing battery participation and declining reliance on thermal generation continue to support more competitive wholesale pricing outcomes across much of the market.
The continued softening of forward electricity prices is particularly notable, with most regions now trading well below long-term averages. This suggests market participants are becoming increasingly confident in the ability of new renewable and storage projects to support future supply requirements.
Despite these positive developments, market conditions remain influenced by weather patterns, generation availability and the ongoing transition of the electricity system. As renewable penetration increases, factors such as curtailment, storage deployment and transmission constraints will continue to play an important role in shaping market outcomes.
Leading Edge Energy will continue to monitor these developments closely to help clients navigate changing market conditions, manage risk and make informed energy procurement decisions.
Explainer: Why we focus on Wholesale Futures Prices
Wholesale Futures Price: This reflects what the market expects wholesale electricity spot rates to be in future periods. The offers that commercial and industrial (C&I) customers receive via Leading Edge Energy are closely correlated to wholesale prices on the ASX Energy futures market; this is why we focus on these prices in our commentary.
Spot Price: This represents how much the spot market is charging for electricity currently based on demand and supply. Spot prices go up when demand is high and supply is tight. You can view live Spot Prices here.
You can learn more about the difference between wholesale electricity futures and spot prices in our blog section.
Disclaimer: The information in this communication is for general information purposes only. It is not intended as financial or investment advice and should not be interpreted or relied upon as such.
We source, analyse, compare and rank commercial, industrial and multi-site energy quotes. Obligation Free.
Chat with one of our experienced consultants today and get the insights your business needs to help manage the risks associated with volatile electricity and natural gas markets. Our energy procurement service is obligation-free and provides a time-saving way of securing lower energy rates from our panel of energy retailers.
Get advice from our Energy Management Consultants

Ewen Beard
Sales Manager
Get in Touch
Feel free to call or e-mail us. Or just fill in the form below and we’ll contact you for an obligation-free discussion.
Are you ready to save on business energy costs?
Get StartedLeading Edge Energy is proud to be a signatory of the National Customer Code for Energy Brokers, Consultants and Retailers.