As FY26 begins, energy buyers face a complex but time-sensitive opportunity. Spot prices plunged across the National Electricity Market (NEM) in July.
Average 2026 futures across New South Wales, Victoria, Queensland, and South Australia dropped to $95/MWh from June (1.26%).
The fall in spot prices was driven by milder winter conditions, stronger renewable generation, and fewer unplanned outages, particularly in NSW and Victoria.
Average spot prices dropped 62% in NSW (to $96.95/MWh) and 69% in VIC (to $82.13/MWh), with similar declines in Queensland and South Australia.
But beneath the surface, significant headwinds remain — which is why now may be a good opportunity to lock in favourable futures contracts.
Structural Risks Remain Front and Centre
The month began with a major supply disruption as ExxonMobil’s Longford gas processing facility in Victoria suffered an outage, pushing east coast gas prices above $19/GJ, up from under $14 just weeks prior.
This reignited concerns around gas-linked electricity generation costs, particularly for southern states relying on gas during peak periods or when renewables underperform.
At the same time, AEMO issued new warnings that large-scale solar farms in South Australia and Victoria could face curtailment rates of up to 65% by 2027, due to delays in key transmission upgrades.
The VNI-West interconnector, a crucial project linking Victoria and NSW, is now forecast to cost up to $11.4 billion — more than double earlier estimates. These delays and cost blowouts threaten the pace of renewable integration and cast doubt on reliability projections for the late 2020s.
Coal generator performance remains under pressure. In June, a catastrophic air duct failure at Yallourn knocked three of four units offline, removing 1,100 MW of baseload capacity at a critical time.
While some units returned in July, unplanned outages at both Yallourn and Loy Yang A continued to drag on forward confidence.
AEMO’s latest system reliability data shows these units underperforming well below expectations, contributing to the recent upward pressure on futures.
Futures Shift, Spot Falls — But the Outlook is Tightening
- NSW closed at $117/MWh, down from $121 at the July open and $122 in June.
- VIC futures settled at $78/MWh, still 12% higher year-on-year
- SA and QLD futures also trended upward, particularly in 2027–2028.
This upward shift reflects a mix of winter hedging demand, longer-term reliability concerns, and structural volatility, particularly around thermal retirements, firming investment gaps, and network delays.
Despite falling spot prices, forward markets tell a different story.
What This Means for Energy Buyers
The message is clear: short-term relief does not equal long-term certainty.
If your electricity contract is due to expire in the next 6–12 months, now remains a strategic window to review, negotiate, and lock in competitive pricing.
Leading Edge Energy helps you assess the full picture — spot trends, futures curves, policy risk, and global pressures — to make an informed, timely decision.
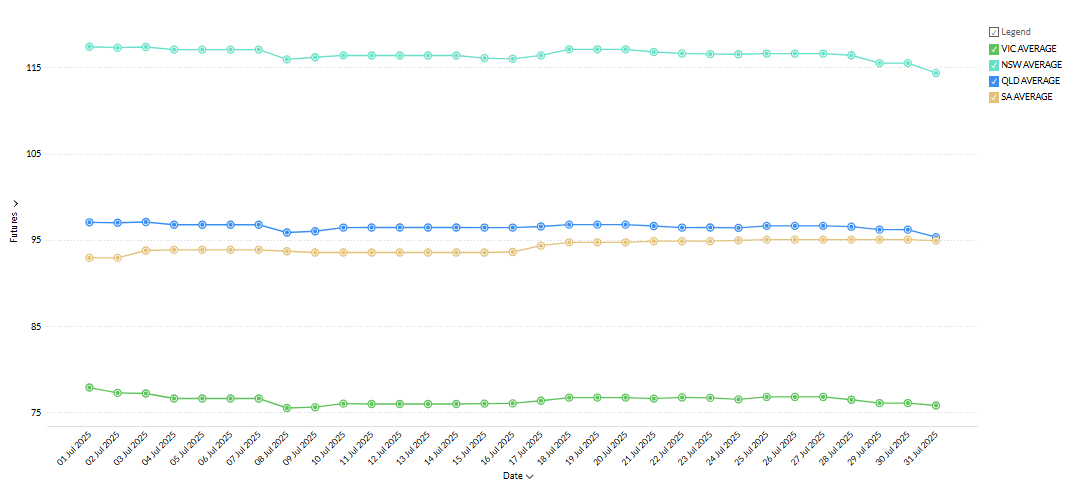
Futures – Average of Terms
National Electricity Futures
The average electricity futures price for 2026 across New South Wales, Victoria, Queensland, and South Australia closed July at $123/MWh — up sharply from $100.75/MWh at the end of June.
This 22% month-on-month increase marks a steep rise and reflects growing unease across the market as winter volatility, ageing coal constraints, and long-term uncertainty converge.
The price surge was largely driven by increased hedging demand in NSW, Victoria, and South Australia, where colder temperatures, tighter reserve margins, and generation disruptions — including lingering outages at Yallourn and Loy Yang A — amplified short-term risk.
While Queensland futures remained more stable due to its strong baseload profile, the broader southern movement was enough to pull the national average significantly higher.
What’s notable is that this rise wasn’t purely reactive to spot price fluctuations. The futures market is increasingly pricing in structural risks on the horizon. These include:
- Delays and cost blowouts in key infrastructure projects like VNI West, Marinus Link, and Snowy 2.0
- Accelerating thermal retirements, including looming uncertainty around Eraring’s 2025 closure
- Slower-than-expected deployment of long-duration storage and gas firming assets
- Ongoing volatility in east coast gas supply, particularly after disruptions at Longford
- Surging transmission build costs (up to 55% in some cases), which raise long-term delivery risks
- A persistent lack of investor clarity around the Capacity Investment Scheme rollout and firming targets
The jump in futures also coincides with higher international energy prices, driven by geopolitical instability, particularly in the Middle East.
This is relevant because much of Australia’s gas-fired generation — especially in Victoria and South Australia — remains exposed to LNG-indexed pricing through domestic contract linkages.
This July rally may represent more than just a seasonal hedge. It could mark the start of a sustained revaluation of 2026 and beyond, as traders weigh the growing mismatch between decarbonisation ambition and delivery timelines for firm, flexible capacity.
Spot Market Price Changes
| Period | FY 2024 | FY 2025 | Movement |
|---|---|---|---|
| FY Price | $80/MWh | $107/MWh | ⇧ 34% YoY |
| April | $85/MWh | $93/MWh | ⇧ 9% YoY |
| May | $155/MWh | $97/MWh | ⇩ 37% YoY |
| June | $159/MWh | $232/MWh | ⇧ 46% YoY |
| July | $163/MWh | $109/MWh | ⇧ 33.13% YoY |
In July 2025, the National Electricity Market (NEM) recorded an average spot price of $109/MWh, dropping 53% from June’s $232/MWh.
This reverses the sharp upward trend from March ($79/MWh) April ($93/MWh), and May ($97/MWh) and June ($232/MWh).
The year-to-date average for 2025 now sits at $109/MWh.
FY25 continues to show elevated spot price trends across the NEM, despite volatility.
The June spike to $232/MWh skews the FY-to-date average upward, but July’s 53% MoM drop shows how fast market dynamics can shift.
While the YoY FY price is up 33.13%, the July data points to a possible stabilisation — though at a higher level than FY24 averages.
If you’re planning forward procurement strategies, it is worth watching August closely to confirm whether July was an anomaly or a new plateau.
State Electricity Markets
New South Wales
Electricity Futures Prices
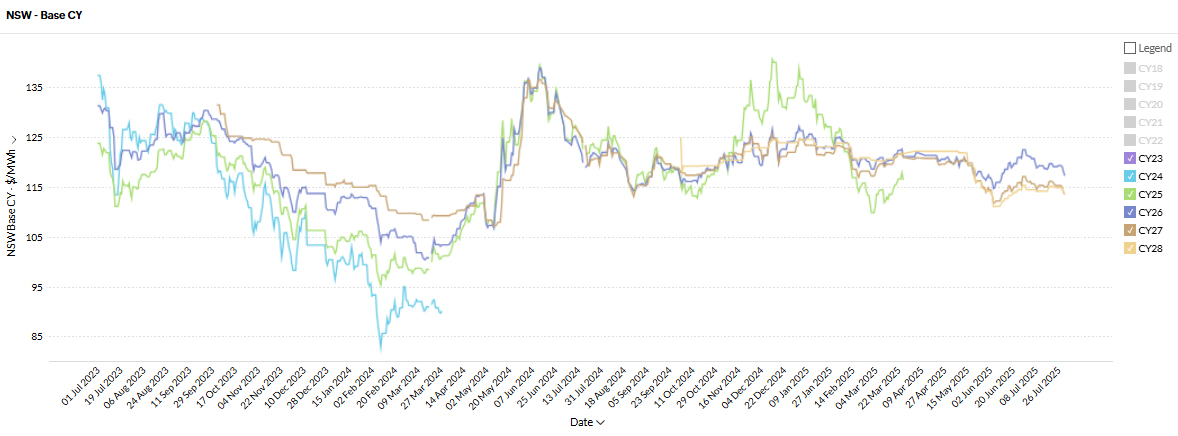
New South Wales electricity futures for 2026 opened July at $121/MWh and softened slightly over the month, closing at $117/MWh — a $4 decline that unwinds June’s late rally and signals a modest recalibration in forward risk.
Longer-dated contracts also eased:
- 2027 futures closed at $113/MWh (down from $116)
- 2028 futures at $113/MWh (down from $115)
The uniform decline suggests a mild easing in market tension, likely driven by subdued winter demand, stable spot prices, and improved generator availability.
Still, risks persist — particularly the declining reliability of NSW’s coal fleet, which continues to inject volatility. Unplanned outages and derating of legacy units are increasingly viewed as structural price risks.
This contrasts with June’s firmness, driven by hedging and tight supply. July’s retreat may reflect a short-term downgrade in risk, but confidence in medium-term supply remains fragile.
At $117/MWh, 2026 futures are now $5 lower than in July 2024. The year-on-year drop suggests a slightly more settled outlook, underpinned by renewables, batteries, and grid upgrades.
Electricity Spot Prices
Average electricity spot prices in New South Wales fell from $256.20/MWh in June to $96.95/MWh in July — a 62% month-on-month drop.
Prices were also 24% lower than in July 2024 ($127.17/MWh), reflecting improved supply conditions and reduced volatility.
The correction was driven by milder weather, strong renewable output, and fewer coal constraints.
Evening peaks still pushed prices up, while negative prices occurred during sunny, breezy afternoons — highlighting the increasing role of weather-driven variability in NSW price formation.
Energy Generation Mix
Coal remains the dominant source, generating 66.3% of electricity (4,470 GWh).
Renewables contributed 30.3% (2,042 GWh). Wind was the largest contributor among renewables, supplying 12.7% (858 GWh).
Rooftop Solar delivered 7.6% (513 GWh) and Utility-Scale Solar added 7.1% (477 GWh).
Gas made up 2.9% (195 GWh) while hydro generated 2.7% (180 GWh).
Battery discharge was minimal at 0.5% (30 GWh) but expensive, averaging $148.49/MWh.
Weighted average prices for each generation category in NSW for July 2025:
- Renewables (Wind, Solar, Hydro): $73.65/MWh
- Coal: $107.86/MWh
- Gas (including Distillate): $162.04/MWh
- Battery (Discharging): $148.49/MWh
Victoria
Electricity Futures Prices
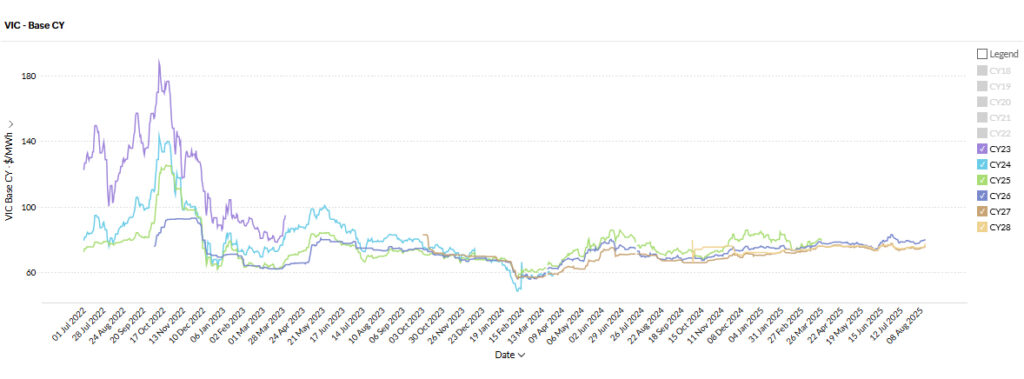
Victoria electricity futures for 2026 opened July at $82/MWh and closed at $78/MWh, recording a $4 decline over the month.
The softening reflects an easing in short-term hedging pressure, likely driven by mild winter conditions, strong wind output, and lower spot price volatility.
Longer-dated contracts also edged down:
- 2027 closed at $74.50/MWh (from $76.11)
- 2028 at $75.23/MWh (from $75.97)
This uniform curve retreat suggests traders view recent pricing as cyclical rather than structural.
However, futures remain elevated year-on-year: 2026 prices are 12% higher than July 2024’s $69.68/MWh, reflecting persistent concern over long-term reliability.
Despite growing renewable generation, Victoria’s aging coal fleet — particularly Loy Yang A — continues to pose outage risk, while delays in firming and transmission investment cloud confidence.
The forward curve reflects a market balancing short-term stability with long-term uncertainty as Victoria transitions away from legacy baseload.
Electricity Spot Prices
Average electricity spot prices in Victoria fell from $264.60/MWh in June to $82.13/MWh in July — a 69% drop.
Prices were also 45% lower year-on-year compared to $149.14/MWh in July 2024, reflecting easing wholesale pressure.
The decline was driven by strong wind generation, stable baseload, and mild winter demand.
Spikes were brief and confined to evening peaks, while negative prices were common during sunny, low-demand periods, underlining the growing influence of variable renewables on Victorian price dynamics.
Energy Generation Mix
Coal remained the dominant source, generating 57.4% of electricity (3,024 GWh).
Renewables contributed 39.0% (2,054 GWh). Wind was the largest contributor among renewables, supplying 28.8% (1,516 GWh).
Rooftop Solar delivered 5.2% (274 GWh) and Utility-Scale Solar added 2.3% (121 GWh).
Hydro generated 2.7% (143 GWh).
Gas made up 2.7% (144 GWh).
Battery discharge was minimal at 0.9% (46 GWh).
Weighted Average Prices – Victoria, July 2025
- Renewables (Wind, Solar, Hydro): $60.22/MWh
- Coal: $90.87/MWh
- Gas: $186.69/MWh
- Battery (Discharging): $180.75/MWh
Queensland
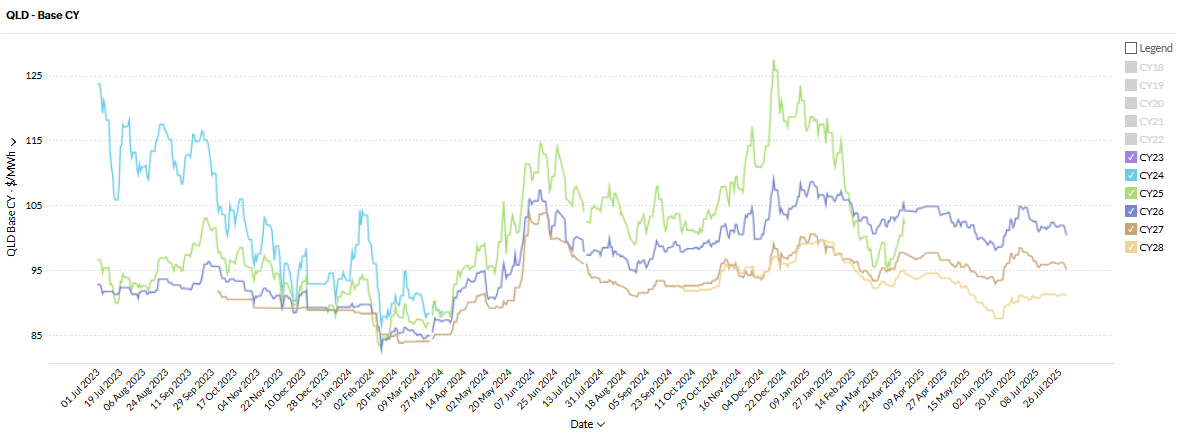
Queensland electricity futures for 2026 opened July at $103.87/MWh and closed at $99.88/MWh, posting a $3.99 decline.
The drop reflects a modest easing in forward risk, likely due to mild winter conditions, consistent generator performance, and limited spot price volatility.
Longer-dated contracts showed mixed movement:
- 2027 closed at $95.28/MWh, down from $97.44
- 2028 rose slightly to $91.25/MWh, from $90.61
The declines in 2026 and 2027 suggest reduced hedging activity, as short-term confidence improves.
However, the slight uptick in 2028 pricing may signal longer-term concern about firming capacity, asset retirements, and coal viability.
Queensland maintains strong baseload generation from black coal and gas, providing a more stable forward curve than southern states. Still, risks remain around coal reliability, gas prices, and the pace of renewable and transmission rollout.
Year-on-year, 2026 futures are up slightly — $99.88 vs $98.23/MWh, a 1.7% increase, reflecting cautious market stability. Queensland electricity futures for 2026 opened June at $99.69/MWh, before climbing steadily to close the month at $105/MWh, reflecting renewed volatility and shifting risk sentiment.
Futures for 2027 and 2028 also tracked upward, finishing June at $98/MWh and $91/MWh, respectively — signalling that price uncertainty is extending beyond the near term, albeit with a flatter curve.
This marks a 1.94% increase compared to the same period last year, when futures were trading at $103.00/MWh — pointing to modest upward pressure despite softer spot demand and increased rooftop solar generation during winter daylight hours.
While the short-term curve has relaxed, long-term pricing remains influenced by Queensland’s high gas exposure, coal plant retirement timelines, and lagging large-scale storage rollout.
These structural uncertainties continue to weigh on forward sentiment, even as immediate trading conditions have moderated.
Electricity Spot Prices
Average electricity spot prices in Queensland dropped from $169.34/MWh in June to $82.13/MWh in July, a 52% decrease.
Prices were also 31% lower year-on-year, down from $119.06/MWh in July 2024, reflecting stabilised supply and low volatility.
Daytime oversupply from rooftop solar and wind drove frequent negative pricing, while strong baseload capacity limited evening peaks.
Queensland’s market in July was marked by ample generation, low volatility, and balanced conditions, though long-term risks around coal and gas persist.
Energy Generation Mix
Coal remained the dominant source, generating 63.0% of electricity (3,646 GWh).
Renewables contributed 30.3% (1,752 GWh). Rooftop Solar was the largest renewable contributor, delivering 11.1% (642 GWh), followed by Utility-Scale Solar at 8.3% (479 GWh) and Wind at 8.0% (462 GWh).
Gas made up 6.1% (353 GWh) while hydro accounted for 2.4% (138 GWh).
Battery discharge was minimal at 0.6% (33 GWh).
Weighted Average Prices – Queensland, July 2025
- Renewables (Wind, Solar, Hydro): $44.20/MWh
- Coal: $91.01/MWh
- Gas (including Distillate): $129.51/MWh
- Battery (Discharging): $167.37/MWh
South Australia
Electricity Futures Prices
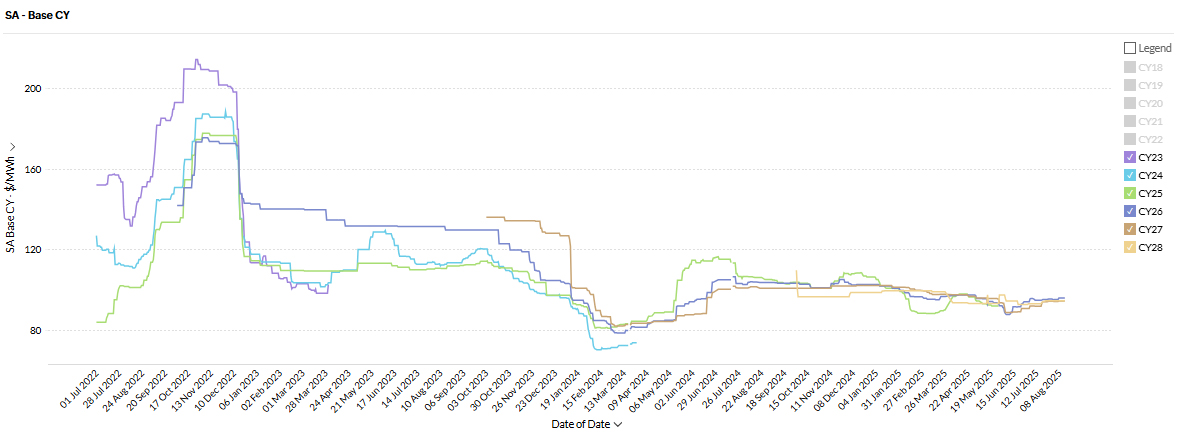
South Australia electricity futures for 2026 opened July at $94.41/MWh and closed slightly higher at $95.10/MWh, a modest $0.69 increase.
The movement reflects ongoing market caution, likely due to SA’s heavy reliance on variable renewables and interconnector exposure during winter peaks.
Longer-dated futures also rose:
- 2027 closed at $94.51/MWh (up from $91.00)
- 2028 at $94.80/MWh (up from $93.00)
This upward curve suggests renewed forward buying interest, possibly tied to firming concerns, network congestion, and the rising cost of balancing high-VRE supply.
As an edge-of-grid state with limited dispatchable resources, SA remains vulnerable to weather-driven volatility and transmission constraints.
Unlike NSW, Victoria, and Queensland — all of which saw futures soften — SA’s steady rise signals persistent structural risks.
Still, 2026 futures are down year-on-year, closing 7.6% below July 2024’s $102.96/MWh, suggesting short-term calm, but long-term caution remains.
Electricity Spot Prices
Average electricity spot prices in South Australia fell from $250.40/MWh in June to $164.95/MWh in July — a 34% month-on-month drop.
Prices were also 32% lower year-on-year, down from $241.22/MWh in July 2024, reflecting improved balance but still elevated levels.
Volatility persisted due to SA’s high reliance on renewables and limited firming capacity.
Spikes occurred during wind lulls at evening peaks, while negative prices dominated sunny, breezy periods when renewables oversupplied demand.
Energy Generation Mix
Renewables dominated the mix, generating 68.9% of electricity (957 GWh).
Wind was the largest contributor, supplying 53.6% (745 GWh), followed by Rooftop Solar at 11.1% (153 GWh) and Utility-Scale Solar at 4.2% (58 GWh).
Gas made up 28.4% (394 GWh).
Battery discharge accounted for 2.5% (35 GWh) and remained costly, averaging $293.88/MWh.
Weighted Average Prices – South Australia, July 2025
- Renewables (Wind, Solar): $59.19/MWh
- Gas (including Distillate): $401.98/MWh
- Battery (Discharging): $293.88/MWh
As FY26 progresses, energy decisionmakers are navigating a landscape of rapidly evolving fundamentals, from coal outages to renewables ramping up, policy reform, and cost pressures rippling through infrastructure.
Policy & Market Reform — Capacity Underwriting Strengthens
In July, the Federal government expanded the Capacity Investment Scheme by 25%, bringing the total underwritten clean energy pipeline to 40 GW by 2030 — an increase of 8 GW, including firming storage capacity.
This move reflects a pressing need for dispatchable supply as thermal assets retire and helps support investor confidence amid heightened risk. Markets now interpret CIS-backed revenue support as a strengthening anchor for contract structures and long-dated pricing expectations.
Infrastructure Green Lights — Projects Making News
The federal government granted environmental approval for the $5 billion Marinus Link, tying Tasmania to Victoria via a second 750 MW cable.
Marinus is key to turning Tasmania into a clean energy exporter and alleviating the solar curtailment and price volatility plaguing southern states.
Yet political gridlock in Tasmania and opposition resistance post-election threatens timely delivery.
Meanwhile, AEMO reports a near doubling of completed wind, solar and battery projects in FY25, with hybrids and grid-forming inverters now mainstream.
In the pipeline, landowners and planners are eyeing dozens of REZbased “megahubs” in NSW’s Central-West and Hunter Central Coast zones, and Queensland is advancing no fewer than twelve REZ proposals slated to host gigawatts of solar, wind, and storage.
Notably, the Australia–Asia Power Link (Sun Cable) remains on track: 17–20 GW solar, plus one of the world’s largest batteries, with export cables to Singapore under development, underscoring Australia’s potential as an energy superpower.
Lastly, landmark approvals include Ace Power’s 200 MW solar farm and 200 MW/400 MWh battery in WA, awarded development consent in June. These projects signal a high-growth era for grid-scale renewables. o the incident and inspecting similar equipment across the facility.
This outage contributed to a broader strain on the National Electricity Market (NEM), as multiple units at Yallourn experienced unplanned outages around the same period.
By mid-June, three of the four units were offline, leading to reduced baseload power availability in Victoria. Compounding the issue, AGL’s Loy Yang A power station also reported a unit out of service, further tightening supply.
The Australian Energy Market Operator (AEMO) noted that these concurrent outages, combined with low wind and solar generation and colder winter temperatures, placed the grid under significant pressure.
While gas-fired generation and high gas storage levels at the Iona facility provided some relief, the situation highlighted the challenges of relying on ageing thermal assets during peak demand periods.
Yallourn Power Station, scheduled for closure in 2028, has been identified as one of the most unreliable in the region.
A report from Reliability Watch indicated that between October 2024 and March 2025, Yallourn experienced 18 breakdowns, despite only five planned outages, emphasizing the plant’s declining reliability.
This series of events underscores the urgent need for investment in more reliable and sustainable energy infrastructure to ensure grid stability and meet future energy demands.
Reliability Woes & Coal Fragility
The Yallourn Power Station saga continues to dominate the reliability narrative. A second major structural failure in July at Unit 3 (air-duct collapse) extended outages into the month and prompted renewed safety probes by the Mining & Energy Union.
The Reliability Watch report, released in July, confirmed Yallourn and Loy Yang A were among the most unreliable coal units nationally — with breakdown rates at more than 30% above planned levels.
EnergyAustralia reaffirmed its commitment to closing Yallourn in 2028 even as EY Parthenon secured government contracts linked to transition safetynet deals, suggesting coal may remain on standby longer than policy timelines.
These developments deepen structural risk pricing in forward markets and underline the fragility of thermal baseload.
Gas Supply & Pricing Flashpoints
July also brought another gas shock — an outage at Longford catalysed a spike in east-coast gas prices from sub-$14/GJ to nearly $20/GJ within days [turn0news28].
Australia’s heavy reliance on LNG linkage to oil benchmarks means domestic electricity prices remain sensitive to such supply shocks.
Gas-based generation margins in southern states tightened, reinforcing concern over winter generation adequacy and prompting early hedging activity.
Grid Constraints & Curtailment Risks
AEMO warned that solar generation in SA and VIC could face curtailment rates of up to 65% by 2027, if transmission bottlenecks like the delayed VNIWest interconnector are not addressed.
VNIWest’s projected cost has ballooned to $11.4 billion, a multi-fold increase that is pushing power price risk onto consumers.
This promises to complicate grid integration of new renewables and deter investment without faster infrastructure build-out.
Investment Signals & Capital Flows
Australia’s Clean Energy Finance Corporation (CEFC) recorded a record AU$4.7 billion in investment into renewables, batteries and transmission in FY25 — the highest figures to date.
A recent Dutch pension fund (APG) committed A$1 billion to Octopus Australia’s renewable platform, including NSW solar and Brisbane battery projects, underscoring global institutional appetite for firmed, utility-scale assets.
Meanwhile, over 1.5 GW of large-scale battery storage and 5 GWh of dispatchable capacity reached financial close in Q1 alone, marking one of the strongest starts to a calendar year for investment momentum.
System Stability & Inertia Warnings
According to the latest General Power System Risk Review, closure of legacy coal units like Eraring in NSW raises concerns about declining synchronous inertia.
AEMO flagged potential blackouts without $1.6 billion worth of inertia remediation by 2030.
These risks highlight the lag between coal exit timetables and supporting infrastructure deployment—posing mid-term reliability threats during low-VRE periods.
Strategic Implications for the Market
Coal fragility persists as a structural risk, creating demand for firming assets and elevating future cost-of-serve concerns.
- Transmission delays increasingly translate into curtailment risk, undermining price stability and renewable dispatch.
- Institutional capital is backing firmed renewables, but investor confidence depends on regulatory certainty and project delivery.
- Gas volatility highlights the cost sensitivity of southern generation, reinforcing the value of early fixed contracting windows.
Recent policy signals signal urgency, but political uncertainty—especially around Tasmania’s Marinus Link—could delay critical capacity.
Actionable Advice
For buyers with contracts expiring within the next 6–12 months, August presents one of the last opportunities to engage fixed-rate markets before winter volatility returns.
Reassess procurement dates, assess how reliability risk affects your demand exposure, and consider layering pricing across timeframes cascaded by capacity vs. energy risk.
Identifying which structural risk factors — coal, gas, transmission, curtailment — matter most to your operations will help shape negotiation strategies and lock-in decisions.
Take Control of Your Energy Costs
At Leading Edge Energy, we monitor the energy market daily — including contract trends, regulatory shifts, and live generation and pricing data. We help clients make smarter procurement decisions that align with their risk appetite and budget goals.
Don’t wait until winter demand spikes or gas volatility returns.
Reach out —take control of your energy expenses now before the next shift!
We hope you have found our electricity market update for July 2025 informative and helpful. We understand that these are challenging times, and we are here to support you. If you’d like to delve deeper into the energy market’s previous months, you can find our monthly energy market reviews here.
Why Choose Us?
Expert Advice: Our team of energy consultants has in-depth knowledge of the energy market and can provide tailored advice to suit your business needs.
Cost Savings: Learn how to reduce your electricity costs and improve your business’s energy sustainability.
Proactive Planning: Stay ahead of market changes and make informed decisions with our comprehensive market updates.
Contact our team for advice on reducing electricity costs and improving your business’ energy sustainability. We are here to assist you and explore your options together.
Explainer: Why we focus on Wholesale Futures Prices
Wholesale Futures Price: This reflects what the market expects wholesale electricity spot rates to be in future periods. The offers that commercial and industrial (C&I) customers receive via Leading Edge Energy are closely correlated to wholesale prices on the ASX Energy futures market; this is why we focus on these prices in our commentary.
Spot Price: This represents how much the spot market is charging for electricity currently based on demand and supply. Spot prices go up when demand is high and supply is tight. You can view live Spot Prices here.
You can learn more about the difference between wholesale electricity futures and spot prices in our blog section.
Disclaimer: The information in this communication is for general information purposes only. It is not intended as financial or investment advice and should not be interpreted or relied upon as such.
We source, analyse, compare and rank commercial, industrial and multisite energy quotes. Obligation Free.
Chat with one of our experienced consultants today and get the insights your business needs to help manage the risks associated with volatile electricity and natural gas markets. Our energy procurement service is obligation-free and provides a time-saving way of securing lower energy rates from our panel of fifteen energy retailers.


