In May 2021 we saw that the energy futures market price reversal is in full swing with contracts now trading up to 28% off February lows. The price increases have been driven by a slew of outages in the thermal fleet with a catastrophic explosion and fire at Queensland’s Callide C coal-fired plant causing a statewide blackout this month. The damaged unit will be out of action for 12 months, squeezing supply and likely increasing Queensland’s dependence on gas. To some extent, this is a return to business as usual after an unusual run of good luck. The NEM has been operating without a major unplanned outage since the back-to-back outages at Basslink, Heywood, Loy Yang and Mortlake came to an end in January 2020. Futures contracts are still very low compared to historic averages. Lock in low prices now!
| Indicative Rates | NSW | VIC | QLD | SA |
| Peak | 7 c/kWh | 5.5 c/kWh | 5.9 c/kWh | 5.5 c/kWh |
| Off-Peak | 5 c/kWh | 3.8 c/kWh | 4.2 c/kWh | 3.8 c/kWh |
New South Wales
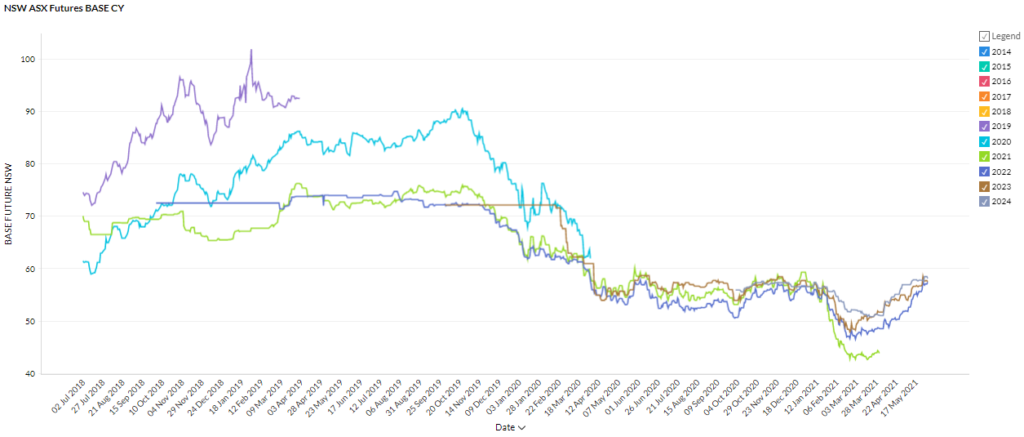
- Futures contracts continued to rise throughout May and have risen up to 23% from March lows.
- 2022 prices jumped 11% just in May to trade around $57/MWh while 2023 and 2024 rose 5% and 2% respectively to trade between $57 and $58/MWh.
How did supply and demand affect price?
- NSW was affected by the explosion at Queensland’s Callide C with NSW exports to QLD increasing to compensate for the loss of generation capacity. Prior to the event Queensland had been a net exporter to NSW.
- Spot prices spiked to $14,882/MWh after the event (settling on $6,800/MWh) and again to ~$2,500/MWh on the 30th of May as low wind output compounded the lost Callide generation.
- The three undamaged units at Callide are not expected to be back online until June 8 with the fourth not expected to be operational for 12 months hence NSW will likely continue to supply electricity across the QLD interconnectors.
Victoria
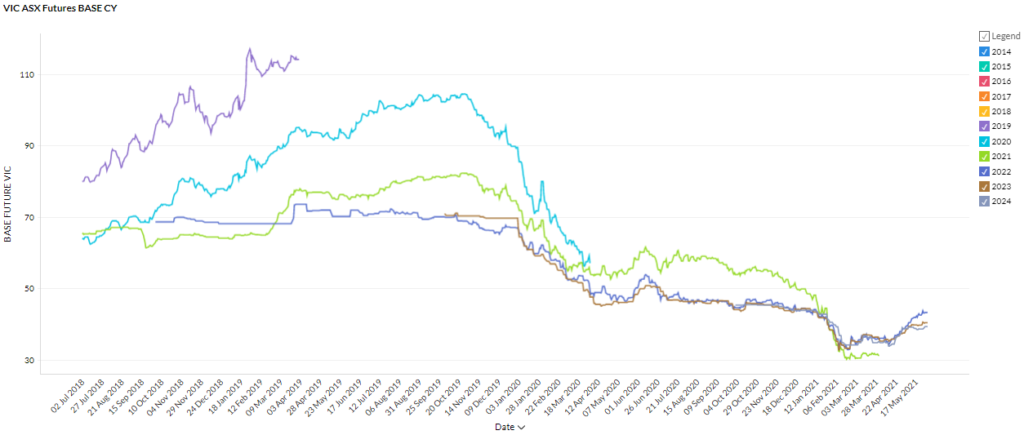
- Victorian futures contracts rose between 1% and 11% over May with 2022 experiencing the biggest gain.
- 2022 is now trading at $43/MWh compared to a low of $33/MWh in February.
- 2023 and 2024 contracts are trading at $39 and $40.50/MWh respectively.
How did supply and demand affect price?
- Spot prices were highly volatile ranging from -$66/MWh to $7,400/MWh. Overall, Victoria experienced 7 half-hour intervals of over $1,700 throughout May – all occurring during the evening peak (between 5:30 pm and 7 pm).
- Coal outages contributed to the volatility with Loy Yang A and B and a unit at Yallourn all coming offline at various points throughout the month.
- Victoria’s largest energy distributor Powercor announced a plan to build up to 20 big batteries across the state. The extra storage should smooth the ‘duck curve’ resulting in lower daily price volatility.
Queensland
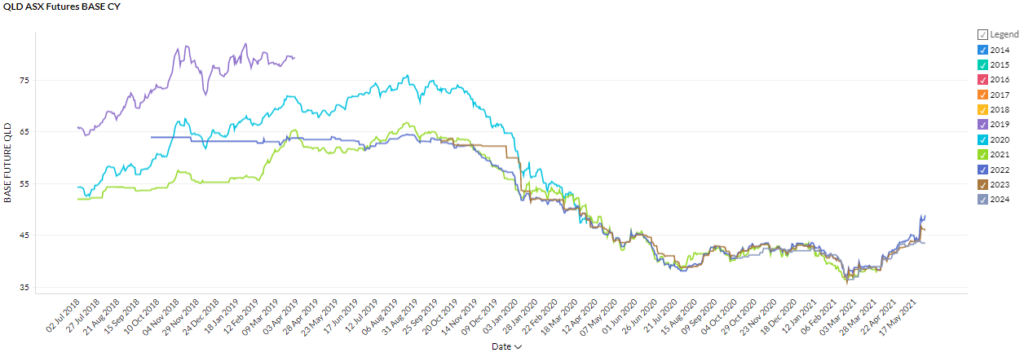
- 2022 and 2023 contract prices rose 12% and 8% respectively over the month of May – spiking sharply after the Callide C explosion.
- 2023 contracts took the news in stride and remained steady around the $43.50/MWh mark.
- Queensland futures contracts are now up to 28% up on February lows.
How did supply and demand affect price?
- On May 25, Queensland’s Callide C coal-fired plant was rocked by a catastrophic explosion that caused around 500,000 homes and businesses to lose power.
- Callide is one of Queensland’s biggest power stations with a capacity of 1,525 MW and the unplanned outage caused a domino effect resulting in a loss of 3,100 MW to the grid in the immediate aftermath of the incident.
- Spot prices spiked to $15,000/MWh for 3 consecutive intervals and were between $2,500 and $12,500 for a further 5 intervals on the 25th of May.
- The damaged unit is expected to be offline for up to 12 months and it is expected that the outage will prompt increased use of gas-fired plants and imports from NSW to fill the shortfall.
South Australia
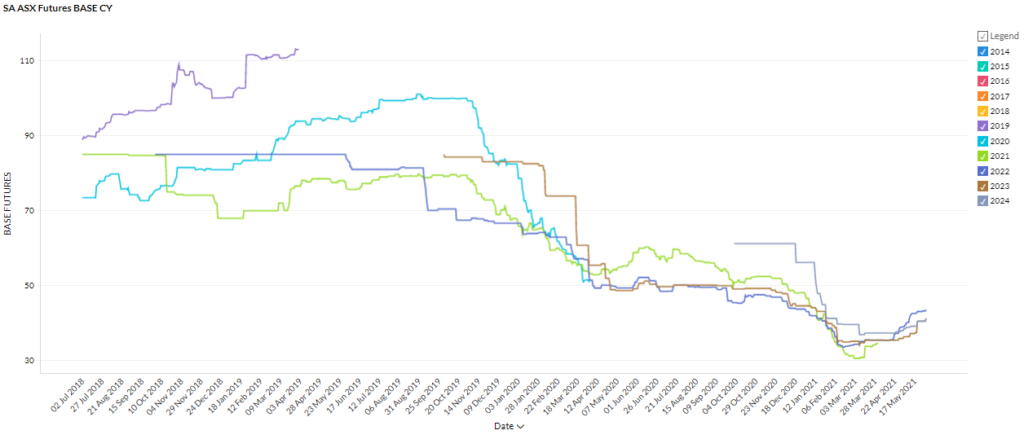
- Futures contracts rose up to 15% over May and are now trading around January levels.
- 2022 is trading at $43/MWh and 2023 and 2024 are trading around $41/MWh.
- Prices are still very low compared to historic averages.
How did supply and demand affect price?
- South Australia continues to benefit from the renewable supply with 125 price intervals below $0/MWh for the month of May.
- High spot prices occur in the evening between 5 and 7 pm (as high as $7,000/MWh but generally around $200/MWh) as solar fades and thermal generation steps in.
- The long-proposed 2nd NSW-SA interconnector has finally been given the green light. The $2 billion dollar project will be the first new interconnector built in the last 15 years and will allow excess renewable energy to be exported from SA while increasing energy security in the state.
This May 2021, the energy market received a stark reminder of the instability in our aging thermal fleet. Futures prices have been in a clear upwards trend since February but are still well below the highs experienced when major outages in interconnector and generation infrastructure persisted for years. Our energy experts can help you navigate this market shift and secure the low prices that are still available in the market. Reach out to us now!
Disclaimer: The information in this communication is for general information purposes only. It is not intended as financial or investment advice and should not be interpreted or relied upon as such.