The steep price gains of the last few months slowed down in August but showed no signs of reversing. Another month of notable renewable output took the steam out of spot prices, easing some market anxiety over the security of supply. Record-breaking months have become typical of the NEM but there were some new achievements in the August energy market as well. We observed the lowest winter operational demand (15,061 MW), record low coal contribution and instantaneous solar contribution to demand (more than half – if only for a few minutes) in August.
To gain more insights into the unfolding energy transition, our new analytical tools allow you to track spot prices and fuel mix. And, as always, our energy experts are available to help translate those insights into an executable plan for your business – reach out now.
| RETAIL RATES | NSW | QLD | VIC | SA |
| PEAK | 7.84 | 6.55 | 7.06 | 6.85 |
| OFF-PEAK | 5.18 | 4.70 | 3.74 | 4.40 |
New South Wales
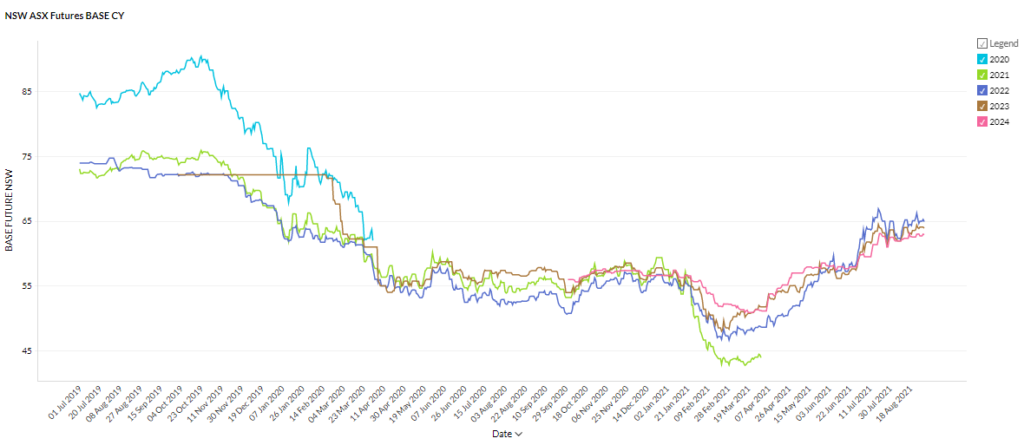
- Futures contracts spent the month bouncing around between ~$62 and $66/MWh but finished largely as they started with 2022 contracts at ~$65/MWh, 2023 contracts at $64/MWh and 2024 at $63/MWh.
- Prices are the highest they have been in the last 12 months.
How did supply and demand affect price?
- Spot prices were low with over 60 intervals priced below $0/MWh. These negative prices generally occurred around midday, highlighting the effect of the ‘duck curve’ on NSW prices.
- Interest in renewable development is soaring in the state with the New South Wales government saying it has been ‘swamped’ with proposals for 34 GW of renewable energy projects for the New England renewable energy zone. The proposals represent a massive 400% of the required 8 GW for the zone.
- The renewable energy zones or ‘REZs’ have been proposed to facilitate the upcoming thermal closures and assist with targeted network upgrades.
Victoria
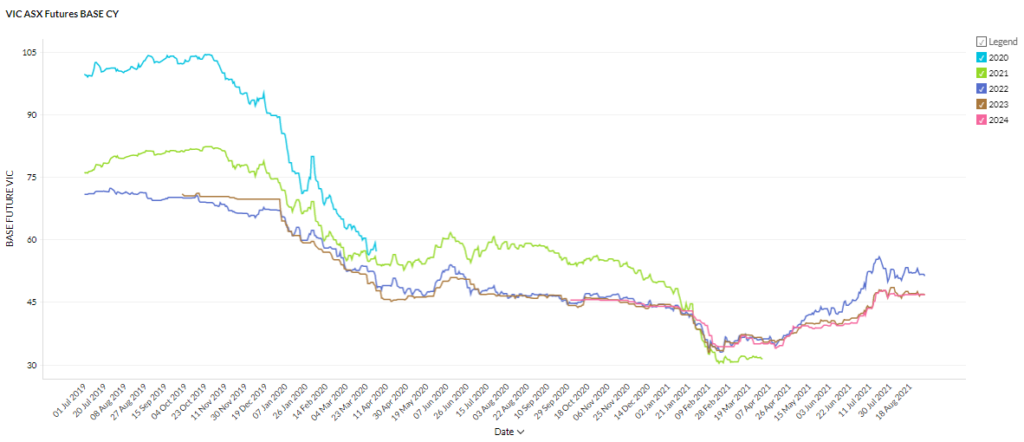
- Victorian futures flatlined throughout August at around $47-$52/MWh.
- There is a stark contrast between 2022 and the later contract periods, with 2022 trading around 10% higher than 2023 and 2024.
- Prices are up around 40% on February lows.
How did supply and demand affect price?
- Renewables continued to take market share from thermal generators with brown coal output falling to a record low of 1,908 MW at 12:40 on August 28. Rooftop solar and wind together contributed more than 70% of state demand during the record breaking moment.
- Like NSW, Victoria is pushing ahead with its REZ plans. The state government this month commissioned AEMO to seek tenders for six major projects in the first stage of its REZ. The government has identified six REZs across the state and established a $540 million fund to finance them.
- Despite the good performance this month, a report from AEMO has flagged further flooding at Yallourn as the biggest short-term threat to supply in the NEM with the site vulnerable to rain.
- Spot prices were soft with plenty of negative pricing periods resulting from abundant renewable supply.
Queensland
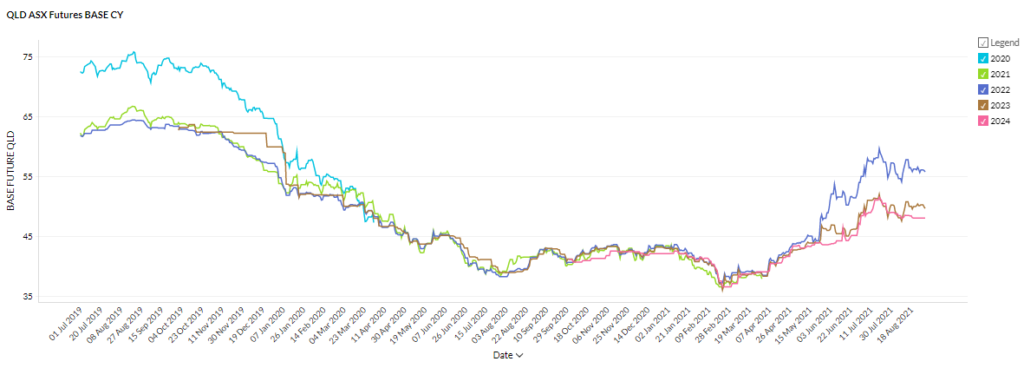
- Futures contracts were volatile during the month but made no clear move up or down.
- 2022 contracts finished the month well above the later contract periods at $56/MW while 2023 and 2024 are trading between $48 and $49/MWh.
- All contract periods are trading well above their February lows around $38/MWh.
How did supply and demand affect price?
- Spot prices were fairly low peaking at $360/MWh and falling as low as -$185/MWh.
- Soft demand and ample renewable generation reduced the impact of gas prices on the electricity markets.
- In a common theme, Queensland is also ramping up its REZ plans with $23 billion in renewable project proposals on the table and a plan to convert a coal export terminal in Dalrymple Bay into a renewable hydrogen production and export facility.
South Australia
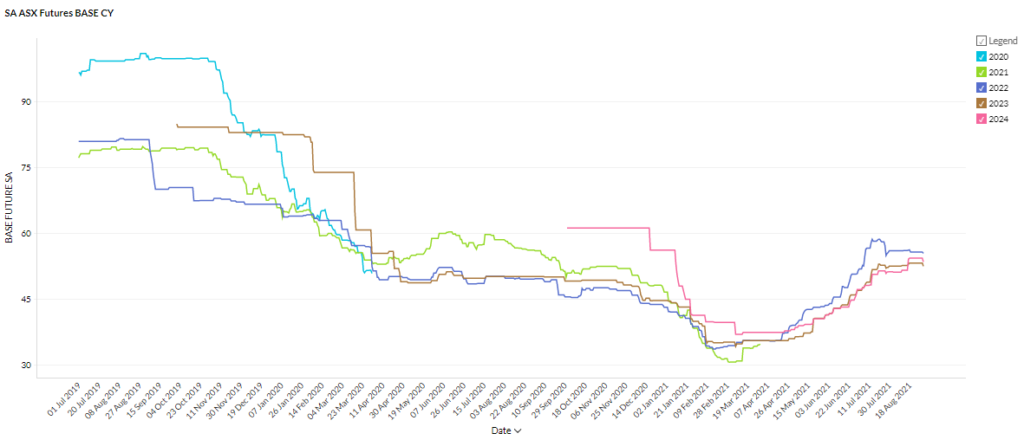
- South Australian futures contracts stabilised throughout August after steady gains since April.
- All contracts are trading between $53 and $56/MWh.
- 2023 and 2024 contracts rose slightly mid month while 2022 dropped slightly.
How did supply and demand affect price?
- South Australia’s abundant supply led to negative prices down to ~ -$300/MWh.
- South Australia frequently has to curtail its renewable output to maintain the integrity of the grid but this may be about to change with the announcement by AEMO that two synchronous condensers have successfully been integrated into the grid. The equipment allows for a higher proportion of renewables to be fed into the grid and reduces the need to call on gas-fired plants to perform certain grid services. South Australia experiences high spot prices whenever it needs to rely on gas so the condensers should translate to lower spot prices.
Pricewise, it was a fairly uneventful month. But behind the flat prices, the story of Australia’s energy transition is speeding up. We are seeing a shift toward a more government-led approach to renewable development as opposed to the market-based, free-for-all that characterised the early stages of the transition. The establishment of REZs is an encouraging sign that network concerns are being managed which may contribute to a smoother road ahead. If you want to learn how to prepare your business for the coming changes, as some others have done, reach out to one of our energy experts now!
Feel free to forward our August energy market update to a business that may also be keen to read it. Subscribe to our up-to-date wholesale electricity market analysis to get them straight into your inbox.
Disclaimer: The information in this communication is for general information purposes only. It is not intended as financial or investment advice and should not be interpreted or relied upon as such.