As we approach the end of the financial year, the energy market is presenting a timely opportunity for savvy businesses to secure competitive electricity rates.
If your energy contract expires in the next 6–12 months, now is the time to act.
Structural pressures — from rising infrastructure costs to global LNG-linked gas volatility — are building, and futures curves for 2027 and 2028 are already starting to edge higher.
On July 1, the Market Price Cap (MPC) increased by 16%, rising from $17,700/MWh to $20,300/MWh.
This annual adjustment, determined by the Australian Energy Regulator (AER), reflects changes in inflation and input costs and is designed to ensure generators are sufficiently incentivised to supply electricity during times of scarcity.
Meanwhile, the cost of building transmission infrastructure is rising sharply. Overhead transmission line costs have jumped by 25–55%, while substation builds are up 10–35%, driven by supply chain constraints, labour shortages, and inflation in materials like steel and copper.
These increases won’t directly affect wholesale electricity contracts but will be felt by consumers through higher network charges from FY2026 onwards. While these charges are broken out separately on electricity bills, they still contribute to the overall upward pressure on energy costs across the NEM.
The cost of building transmission infrastructure is rising sharply. Overhead transmission line costs have jumped by 25–55%, while substation builds are up 10–35%, driven by supply chain constraints, labour shortages, and inflation in materials like steel and copper.
These increases won’t directly affect wholesale electricity contracts but will be felt by consumers through higher network charges from FY2026 onwards. While these charges are broken out separately on electricity bills, they still contribute to the overall upward pressure on energy costs across the NEM.
Reliability is also under strain. In June, an air duct collapse at Victoria’s Yallourn Power Station knocked out three of four units, removing critical baseload power during winter.
This contributed to Low Reserve Condition warnings across Victoria, NSW, and Queensland. AGL’s Loy Yang A also reported a unit offline, compounding supply tightness.
Globally, Middle East tensions — particularly involving Iran — are driving oil prices higher.
Given that Australian LNG contract prices are often indexed to Saudi Aramco benchmarks, this could inflate gas generation costs and feed into electricity markets.
In June 2025, renewable generation fell across all major NEM states, with coal and gas filling the gap during colder, low-output periods. NSW, VIC, QLD, and SA all saw reduced wind and solar shares, while gas use rose sharply in VIC and SA.
Renewables remained the cheapest source of energy (as low as $86.85/MWh in QLD), while coal and gas prices surged, with gas reaching $776.21/MWh in NSW.
Battery discharging costs exceeded $860/MWh in some states, reflecting their role during peak demand.
All of this underscores the urgency of reviewing your energy strategy now. Futures markets remain favourable, but the outlook is volatile.
At Leading Edge Energy, we help you compare offers, navigate risks, and lock in value before winter demand and structural pressures push prices higher.
Futures – Average of Terms
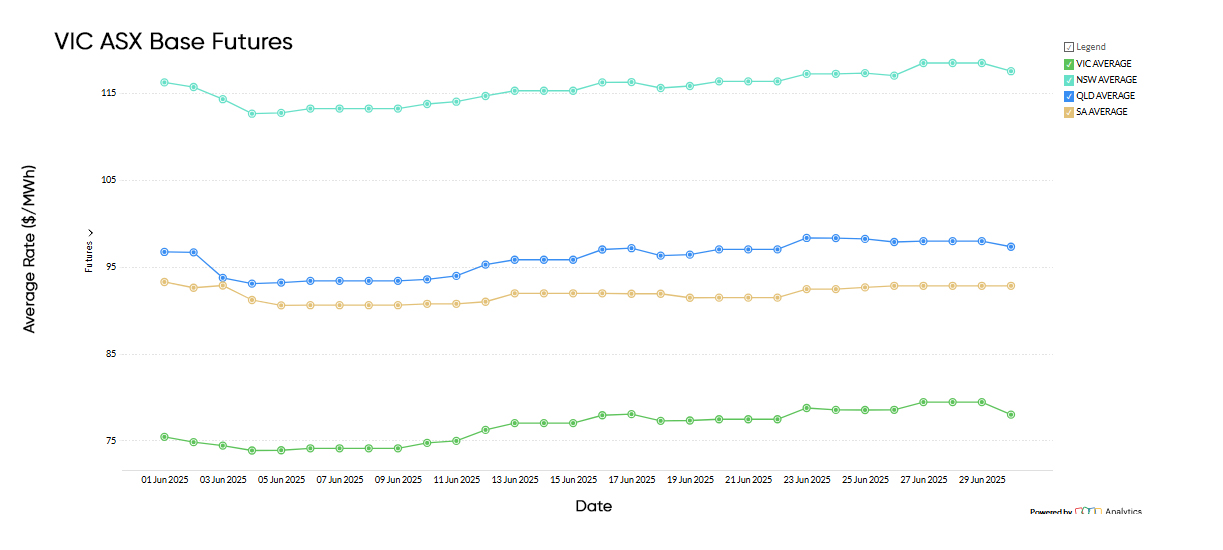
National Electricity Futures
The average electricity futures price for 2026 across NSW, Victoria, Queensland, and South Australia closed June at $100.75/MWh. This represents a slight upward shift driven by generation risk, winter demand forecasts, and volatility in Queensland’s spot market
Despite differing trends across states, the aggregated figure highlights a market still grappling with structural risk, even as long-term confidence improves thanks to renewables and storage.
While May saw relatively mild conditions and few major outages, the June futures curve priced in colder weather, potential demand spikes, and reliance on higher-cost peaking assets — particularly gas.
Adding further upward pressure is the global energy backdrop. Ongoing geopolitical instability in the Middle East, including tensions in the Red Sea, Iran-Israel conflict risk, and OPEC+ supply decisions, have contributed to elevated global oil and LNG prices.
This has a knock-on effect for Australian domestic energy markets, particularly in Queensland and South Australia, where gas sets the marginal price more frequently.
LNG-linked gas contracts continue to act as a transmission belt for global shocks, and these risks are increasingly reflected in the futures market.
Despite this, futures prices remain below the extreme highs seen during the 2022–23 crisis period, indicating improved market confidence in domestic capacity — but uncertainty around fuel supply and storage resilience remains a persistent theme heading into the colder months.
Spot Market Price Changes
| Period | FY 2024 | FY 2025 | Movement |
|---|---|---|---|
| FY Price | $80/MWh | $107/MWh | ⇧ 34% YoY |
| March | $67/MWh | $79/MWh | ⇧ 17% YoY |
| April | $85/MWh | $93/MWh | ⇧ 9% YoY |
| May | $155/MWh | $97/MWh | ⇩ 37% YoY |
| June | $159/MWh | $232/MWh | ⇧ 9% YoY |
June 2025, the National Electricity Market (NEM) recorded an average spot price of $232/MWh, surging 139% from May’s $96.28/MWh.
This continues the sharp upward trend from March ($79/MWh) April ($93/MWh), and May ($97/MWh) with tightening supply and colder winter conditions put pressure on wholesale pricing.
The year-to-date average for 2025 now sits at $97.34/MWh, up 10.6% from the same period in 2024 ($88.00/MWh).
While volatility has clearly returned to the market, the broader average is now trending higher — suggesting more persistent price pressure heading into winter.
State Electricity Markets
New South Wales
Electricity Futures Prices
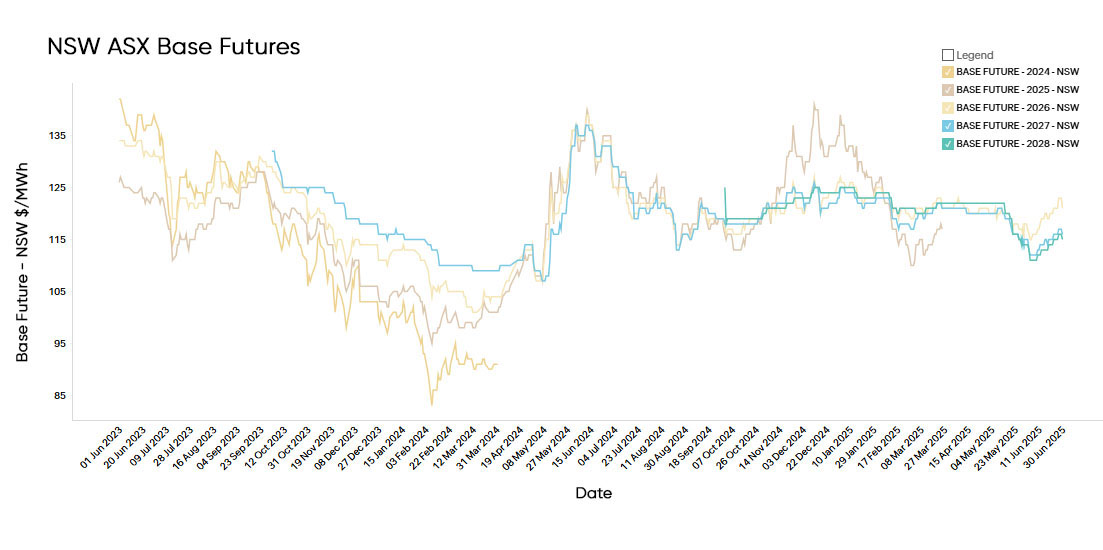
New South Wales electricity futures for 2026 opened June at $117/MWh, tracking relatively flat through the first half of the month amid lower volatility and subdued trading activity.
However, prices firmed in the final week, closing June at $122/MWh — a signal of rising market uncertainty heading into the new financial year.
Longer-dated contracts were less reactive: 2027 and 2028 futures closed at $116/MWh and $115/MWh, respectively, both slightly below their May levels.
This suggests that while near-term price expectations are becoming more sensitive to market conditions, the outer years remain anchored by longer-term structural assumptions around renewables, storage, and transmission buildout.
These figures are notably lower than the same time last year, when 2026 futures were trading at $136/MWh in the wake of extreme price volatility driven by coal outages, gas price spikes, and tight winter supply margins.
The current pricing reflects a more settled market outlook heading into 2026, supported by growing renewable capacity, improved grid stability, and increasing battery and storage deployment.
Nonetheless, structural risks remain as coal retirements accelerate and long-term firming remains uncertain.
Electricity Spot Prices
Average electricity spot prices for New South Wales skyrocketed from $123/MWh month on month from end May to $256/MWh (108%) at the end of June.
Spot prices increased by a massive 68% from June 2024 when prices averaged the $152/MWh mark.
In June 2025, NSW spot prices ranged from a low of –$35.97/MWh to a high of $17,026.18/MWh, reflecting sharp volatility driven by changing supply conditions.
High prices occurred during cold evenings with low wind output, limited coal availability, and strong demand, pushing the grid toward scarcity pricing.
In contrast, negative prices were seen during sunny, breezy days when renewables surged and demand remained subdued, highlighting the growing impact of weather on price formation.
Energy Generation Mix
Renewable energy generation dropped from 31.4% in May to 28.3% in June.
Of that, 9.6% came from wind, 8.7% from utility solar, 7.1% from rooftop solar, 2.6% from hydro, and 0.3% from battery discharging.
Coal generation increased from 63.2% to 66.8%, while gas generation rose slightly from 4.4% to 4.5%.
Weighted average prices for each generation category in NSW for June 2025:
- Renewables (Wind, Solar, Hydro, Bioenergy): $194.29/MWh
- Coal: $283.64/MWh
- Gas (including Distillate): $776.21/MWh
- Battery (Discharging): $864.93/MWh
Victoria
Electricity Futures Prices
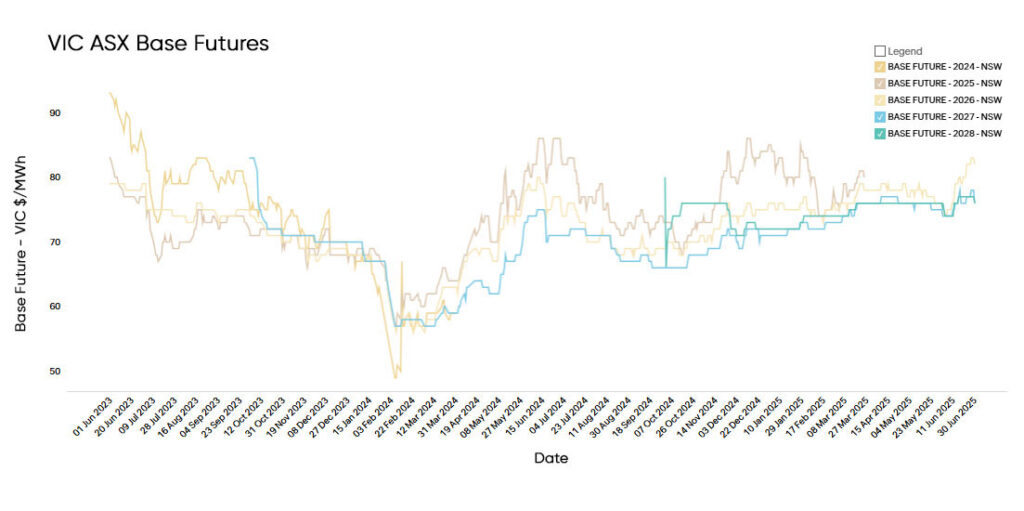
Victorian electricity futures for 2026 opened June at $77/MWh, edging up to $80/MWh by month’s end.
While the movement was modest, it reflected a gradual return of volatility following a relatively stable May.
Longer-dated contracts for 2027 and 2028 also lifted slightly, closing at $74/MWh and $75/MWh, suggesting a cautious upward shift in market sentiment across the curve.
While prices have edged up recently, they remain broadly in line with this time last year, when mid-2024 contracts averaged $77.98/MWh — a period marked by heightened volatility due to coal reliability concerns and tight winter gas supply.
The current futures curve suggests improved market sentiment in Victoria, underpinned by steady renewable generation, increasing battery dispatch, and fewer major outages in the thermal fleet over autumn and early winter.
Still, upside risks persist from national gas exposure, delayed transmission builds, and uncertainty over long-term baseload replacement.
Electricity Spot Prices
Electricity spot prices for Victoria climbed sharply from $78.05/MWh at the end of May to an average of $264.60/MWh in June.
This marks a dramatic rise from $164/MWh in June 2024, highlighting renewed volatility in the market.
In June, prices peaked with one market cap event at $17,500/MWh. There were 239 intervals exceeding the $500/MWh threshold — a stark increase from just nine such events in May.
Electricity Spot Prices
Renewable energy generation dropped from 38% to 37%. Of that 20% came from wind, 3.2% utility solar, 7.6% rooftop solar, 6.3% hydro, and 0.8% battery.
Coal dropped by a percentage point to make up 60% of generation while gas generation climbed significantly from 0.6% to 2.1%.
Weighted average prices for each generation category in Victoria for May 2025:
Energy Generation Mix
Renewable energy generation dropped slightly from 38% in May to 36.7% in June. Of that,
24.1% came from wind, 2.2% utility solar, 5.1% rooftop solar, 5.4% hydro, and 1% battery discharging.
Coal’s share fell from 60% to 54.6%, while gas climbed from 2.1% to 7.7%, driven by increased demand during colder days and reduced renewable availability at peak times.
Weighted average prices for each generation category in Victoria for June 2025:
- Renewables: $163.18/MWh
- Coal: $265.00/MW
- Gas: $163.13/MWh
- Battery (Discharging): $869.32/MWh
Queensland
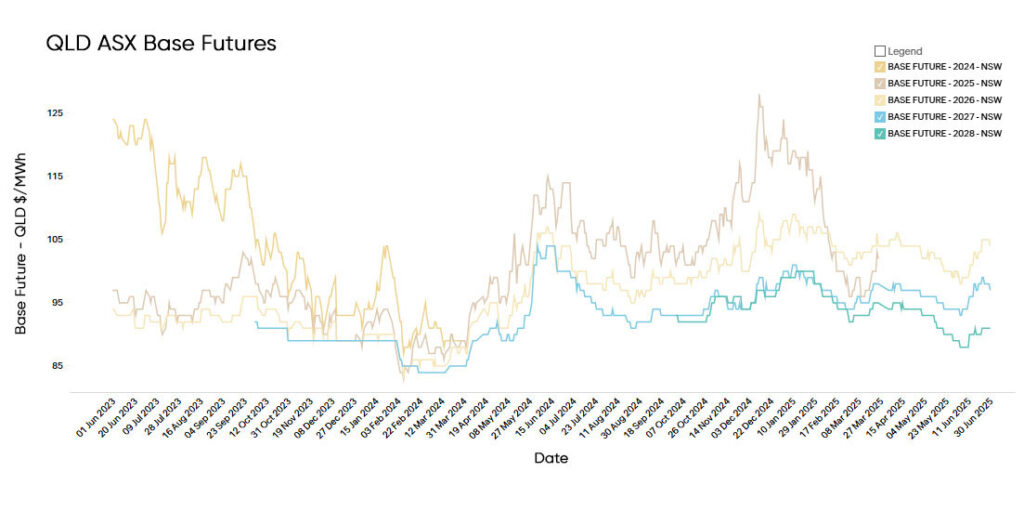
Electricity Futures Prices
Queensland electricity futures for 2026 opened June at $99.69/MWh, before climbing steadily to close the month at $105/MWh, reflecting renewed volatility and shifting risk sentiment.
Futures for 2027 and 2028 also tracked upward, finishing June at $98/MWh and $91/MWh, respectively — signalling that price uncertainty is extending beyond the near term, albeit with a flatter curve.
This marks a 1.94% increase compared to the same period last year, when futures were trading at $103.00/MWh — pointing to modest upward pressure despite softer spot demand and increased rooftop solar generation during winter daylight hours.
While the short-term curve has relaxed, long-term pricing remains influenced by Queensland’s high gas exposure, coal plant retirement timelines, and lagging large-scale storage rollout.
These structural uncertainties continue to weigh on forward sentiment, even as immediate trading conditions have moderated.
Electricity Spot Prices
Queensland’s spot prices surged from $95.63/MWh at the end of May to $169.34/MWh by the end of June.
This marks a 35.8% increase month-on-month and a 35.8% increase compared to June 2024, when prices averaged $124.67/MWh.
The spot market saw heightened volatility throughout June, with a maximum price of $16,567.63/MWh and 65 intervals above the $1,000/MWh threshold.
Energy Generation Mix
Renewable energy generation dropped from 32% to 26.6% in June.
Of that: 9.4% came from rooftop solar, 7.6% from utility-scale solar, 7.0% from wind, 2.2% from hydro, 0.6% from battery storage (discharging)
Coal climbed from 63% to 65.9% of total generation, while gas (including distillate) also increased from 5% to 6.9%.
Weighted average prices for each generation category in Queensland for June 2025:
- Renewables (Solar, Wind, Hydro, Bioenergy): $86.85/MWh
- Coal: $190.91/MWh
- Gas (including Distillate): $404.91/MWh
- Battery (Discharging): $498.18/MWh
South Australia
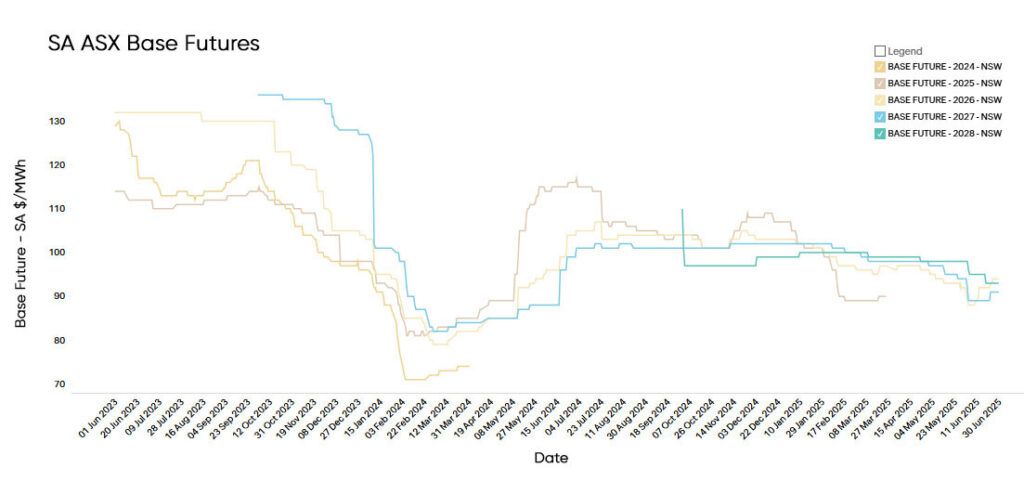
Electricity Futures Prices
South Australian electricity futures for 2026 opened June at $92.39/MWh, rising to $96/MWh as volatility returned, driven by fluctuating wind output and exposure to gas prices.
Futures for 2027 and 2028 held firm at $91/MWh and $93/MWh, underscoring the region’s ongoing sensitivity to variable renewables and volatile gas markets, especially in the near term.
Compared to the same period in 2024, when prices averaged $94.00/MWh, current futures are 2.13% higher.
The upward slope in longer-dated contracts reflects ongoing structural risk, including limited firming capacity, the intermittent nature of renewables, and tight supply margins during peak demand periods.
Electricity Spot Prices
South Australia’s spot prices surged from $83.31/MWh at the end of May to $250.40/MWh at the end of June.
This represents a 41.7% increase year-on-year from $176.68/MWh in June 2024.
The market experienced significant volatility during the month, with a high of $16,983.46/MWh and 226 intervals exceeding $500/MWh.
Energy Generation Mix
Renewable energy generation fell from 70% in May to 62.9% in June. Of that, 48.4% came from wind, 10.3% from rooftop solar, 4.1% from utility-scale solar, and 2.6% from battery discharging.
Gas generation climbed from 27.7% to 34.5%, likely driven by lower wind output during evening peaks and increased demand during colder winter nights.
Weighted average prices for each generation category in South Australia for June 2025:
- Renewables (Wind, Solar, Hydro): $116.01/MWh
- Battery (Discharging): $694.21/MWh
- Gas: $530.57/MWh
Market Price Cap Rises to $20,300/MWh
From July 1, 2025, the Australian Energy Market Commission (AEMC) has officially raised the Market Price Cap (MPC) to $20,300/MWh, up 16% from the previous level of $17,500/MWh.
This change, designed to strengthen the investment signal for new firming capacity, reflects the growing urgency to replace ageing thermal assets and manage increasing volatility as more renewables enter the mix.
While intended to encourage investment, it also raises the ceiling for potential wholesale price spikes — a key consideration for any business not on a fixed-rate contract.
Yallourn Incident Exposes Cracks in Coal Reliability
In June 2025, a significant incident at Victoria’s Yallourn Power Station underscored the fragility of Australia’s ageing coal-fired power infrastructure.
During scheduled maintenance on June 8, an air duct in Unit 3 collapsed, detaching from the boiler and falling to the basement floor.
While no injuries were reported, the unit—accounting for 25% of the plant’s capacity—was taken offline for at least two weeks, with EnergyAustralia initiating investigations into the incident and inspecting similar equipment across the facility.
This outage contributed to a broader strain on the National Electricity Market (NEM), as multiple units at Yallourn experienced unplanned outages around the same period.
By mid-June, three of the four units were offline, leading to reduced baseload power availability in Victoria. Compounding the issue, AGL’s Loy Yang A power station also reported a unit out of service, further tightening supply.
The Australian Energy Market Operator (AEMO) noted that these concurrent outages, combined with low wind and solar generation and colder winter temperatures, placed the grid under significant pressure.
While gas-fired generation and high gas storage levels at the Iona facility provided some relief, the situation highlighted the challenges of relying on ageing thermal assets during peak demand periods.
Yallourn Power Station, scheduled for closure in 2028, has been identified as one of the most unreliable in the region.
A report from Reliability Watch indicated that between October 2024 and March 2025, Yallourn experienced 18 breakdowns, despite only five planned outages, emphasizing the plant’s declining reliability.
This series of events underscores the urgent need for investment in more reliable and sustainable energy infrastructure to ensure grid stability and meet future energy demands.
Transmission Costs Surge: 25–55% Increases in Some Assets
Adding to long-term cost pressures, AEMO and independent analysts have reported significant increases in transmission infrastructure costs:
- Overhead line costs: up 25%–55%
- Substation builds: up 10%–35%
These cost escalations are driven by labour shortages, supply chain constraints, and growing community opposition to large-scale infrastructure.
With these costs ultimately passed on to consumers via regulated network tariffs, we expect these increases to begin flowing through electricity bills from FY2026 onward — with sharp jumps in some distribution zones likely.
Middle East Risk: Iran Tensions Feed Energy Market Volatility
While the local grid faces physical constraints, global risks are adding to market tension. Ben and Ewen discussed the geopolitical situation in Iran and its knock-on effects for oil and LNG prices.
The link between oil and gas pricing remains strong, especially in LNG-export-linked markets like Australia, where domestic gas pricing often reflects Saudi Aramco’s oil price benchmarks.
As tensions escalate in the Middle East, oil price increases could drive up LNG contract pricing, ultimately impacting gas-fired electricity generation costs — and with it, wholesale electricity prices.
This underscores the global interconnectedness of energy pricing, even for domestic users, and reminds us that geopolitical shocks remain a wildcard.
Reserve Capacity Requirements on the Rise
AEMO’s 2025 Reserve Capacity Information Pack indicates a significant increase in the Peak Reserve Capacity Target for the 2027-28 capacity year, rising to 6,238 MW. This uptick reflects growing concerns about meeting future demand amid the retirement of ageing coal assets and the need for additional flexible
ASIC Launches Legal Action for Market Manipulation
Adding to the month’s drama, the Australian Securities and Investments Commission (ASIC) has launched civil proceedings against Delta Power & Energy (Vales Point) over alleged manipulation of the ASX 24 electricity futures market.
This is a major development, marking one of the first enforcement actions in the futures space. It sends a strong signal that regulators are watching closely as derivative markets grow in importance alongside physical electricity trading.
EOFY Opportunity: Time to Lock in Short-Term Contracts
For businesses with energy contracts expiring in the next 6–12 months, this may be the last low-risk window before winter pricing volatility bites.
While spot prices remain elevated, the futures curve has softened — particularly for 2026–2028 contracts. But outages like Yallourn’s, rising transmission charges, and geopolitical tensions in the Middle East all point to ongoing price risk.
Our Advice:
Use EOFY as a catalyst to reassess your procurement strategy, review contract expiry dates, and assess fixed-rate offers while the futures market remains in a dip.
At Leading Edge Energy, we monitor the energy market daily — including contract trends, regulatory shifts, and live generation and pricing data. We help clients make smarter procurement decisions that align with their risk appetite and budget goals.
Take Control of Your Energy Costs
At Leading Edge Energy, we monitor the energy market daily — including contract trends, regulatory shifts, and live generation and pricing data. We help clients make smarter procurement decisions that align with their risk appetite and budget goals.
Don’t wait until winter demand spikes or gas volatility returns.
Reach out —take control of your energy expenses now before the next shift!
We hope you have found our electricity market update for June 2025 informative and helpful. We understand that these are challenging times, and we are here to support you. If you’d like to delve deeper into the energy market’s previous months, you can find our monthly energy market reviews here.
Why Choose Us?
Expert Advice: Our team of energy consultants has in-depth knowledge of the energy market and can provide tailored advice to suit your business needs.
Cost Savings: Learn how to reduce your electricity costs and improve your business’s energy sustainability.
Proactive Planning: Stay ahead of market changes and make informed decisions with our comprehensive market updates.
Contact our team for advice on reducing electricity costs and improving your business’ energy sustainability. We are here to assist you and explore your options together.
Explainer: Why we focus on Wholesale Futures Prices
Wholesale Futures Price: This reflects what the market expects wholesale electricity spot rates to be in future periods. The offers that commercial and industrial (C&I) customers receive via Leading Edge Energy are closely correlated to wholesale prices on the ASX Energy futures market; this is why we focus on these prices in our commentary.
Spot Price: This represents how much the spot market is charging for electricity currently based on demand and supply. Spot prices go up when demand is high and supply is tight. You can view live Spot Prices here.
You can learn more about the difference between wholesale electricity futures and spot prices in our blog section.
Disclaimer: The information in this communication is for general information purposes only. It is not intended as financial or investment advice and should not be interpreted or relied upon as such.
We source, analyse, compare and rank commercial, industrial and multisite energy quotes. Obligation Free.
Chat with one of our experienced consultants today and get the insights your business needs to help manage the risks associated with volatile electricity and natural gas markets. Our energy procurement service is obligation-free and provides a time-saving way of securing lower energy rates from our panel of fifteen energy retailers.