Wholesale electricity prices continue to tumble as the energy market anticipates a COVID-19-induced reduction in demand. While demand in the National Energy Market is down for April 2020, the reduction seen thus far is reasonably consistent with seasonal and long-term trends. Futures markets may be applying an overly generous lockdown discount based on Northern Hemisphere examples. Now is the time to make sure you have the best energy deal. Act now to lock in prices.
New South Wales
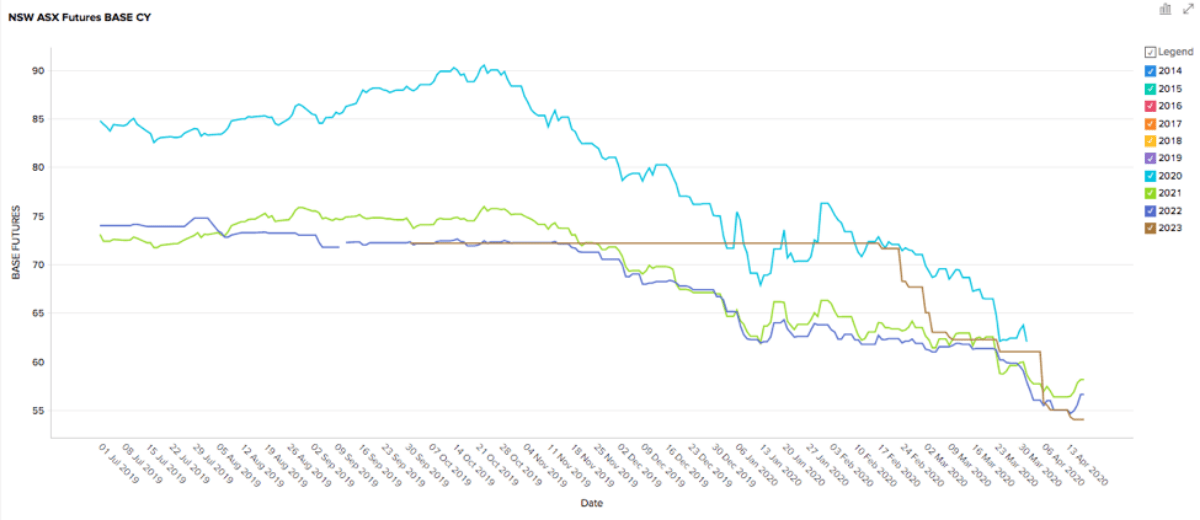
- 2023 prices have fallen 25% from $72 to $54/MWh since mid-February
- 2021 and 2022 prices are $58 and $56/MWh respectively. You have to go back to 2016 to find prices below $60/MWh.
How did supply and demand affect price?
- Operational demand is down around 8% on the previous corresponding period.
- Part of this reduction should be attributed to the COVID-19 lockdown however it should also be noted that there is a long-term downward trend in operational demand in the National Energy Market (NEM) due to the proliferation of rooftop solar PV and other economic drivers.
- Some high-profile media and industry reports have suggested we may see reductions in operational demand in the order of 20-40% but this is not yet occurring and there is already talk of easing lockdown restrictions.
Indicative retail prices*
| Off-Peak | Peak |
| 5c/kWh | 6.7c/kWh |
*Based on offers we have seen in the last week.
Victoria
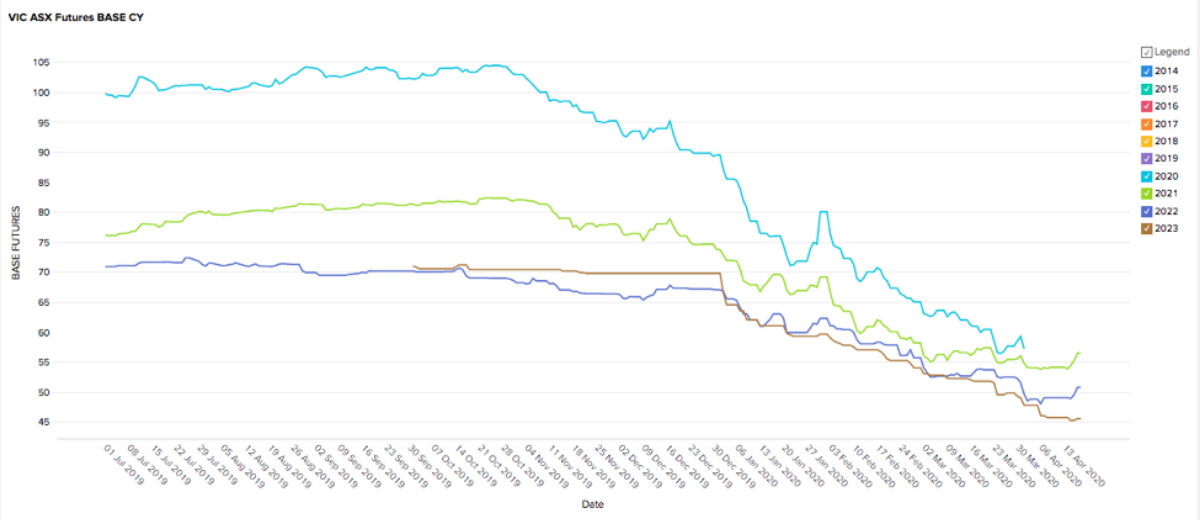
- Victoria’s future prices have continued their stunning descent and 2021, 2022 and 2023 contracts are all trading below $50/MWh
- 2020 prices dropped 42% in 6 months before trading ceased on 31 March.
How did supply and demand affect price?
- Operational demand is down around 10% on the previous corresponding period.
- Again some of this reduction should be attributed to long term trends and the uptake of solar PV (2019 was the second biggest year for rooftop installations in Victoria) as well as the headline-grabbing COVID-19.
- Victoria’s prices began falling in October 2019 as a result of supply pressures easing as Basslink, Loy Yang, and Mortlake overcame consecutive outages. The current drop in demand is the final piece of the puzzle pushing prices to all-time lows.
- Although these low prices are no doubt a welcome relief to struggling businesses they will likely exacerbate the collapse in new generation capacity investment that is desperately needed before significant thermal retirements in 2022/23.
- This increases the chance of a supply squeeze in 2022/23 and for this reason, we believe businesses should lock in prices now.
Indicative retail prices*
| Off-Peak | Peak |
| 4.1c/kWh | 6.1c/kWh |
*Based on offers we have seen in the last week.
Queensland
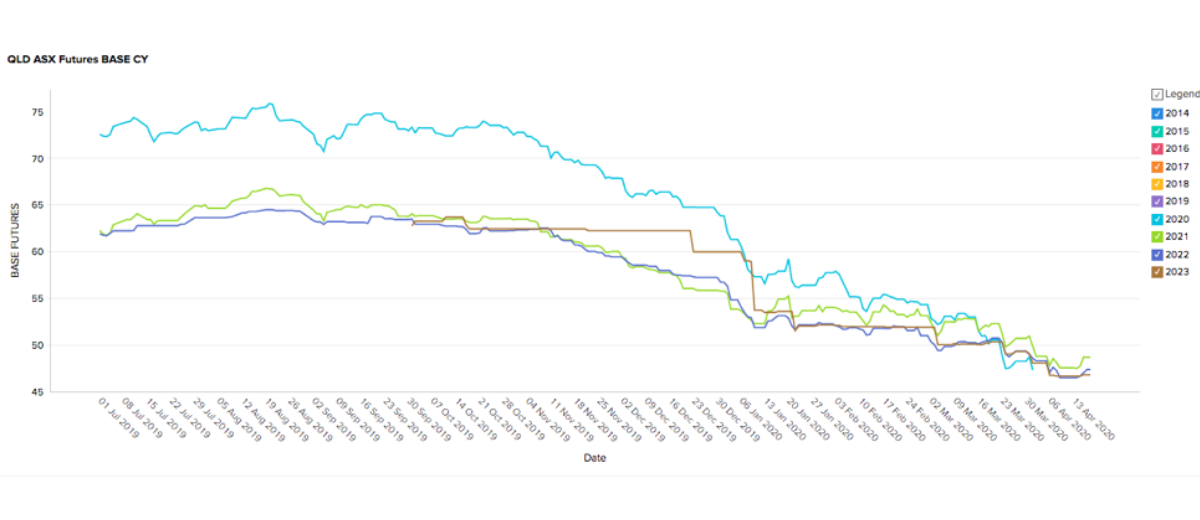
- Queensland’s long downtrend is decelerating finding stability between $46 and $49/MWh.
- Prices have only been below $50/MWh on one brief occasion since 2015.
How did supply and demand affect price?
- Demand is on par with the corresponding period last year (down 2%) so no signs of a COVID-19 slowdown here.
- The crisis is, however, driving gas prices lower which flows through to lower electricity spot prices as gas generation is often the marginal price setter in Queensland.
- The weaker Aussie dollar may in the medium term drive demand for Australian LNG exports as global activity recovers. Even the expectation of this occurring could send futures prices north in a hurry.
Indicative retail prices*
| Off-Peak | Peak |
| 4.1c/kWh | 5.2c/kWh |
*Based on offers we have seen in the last week.
South Australia
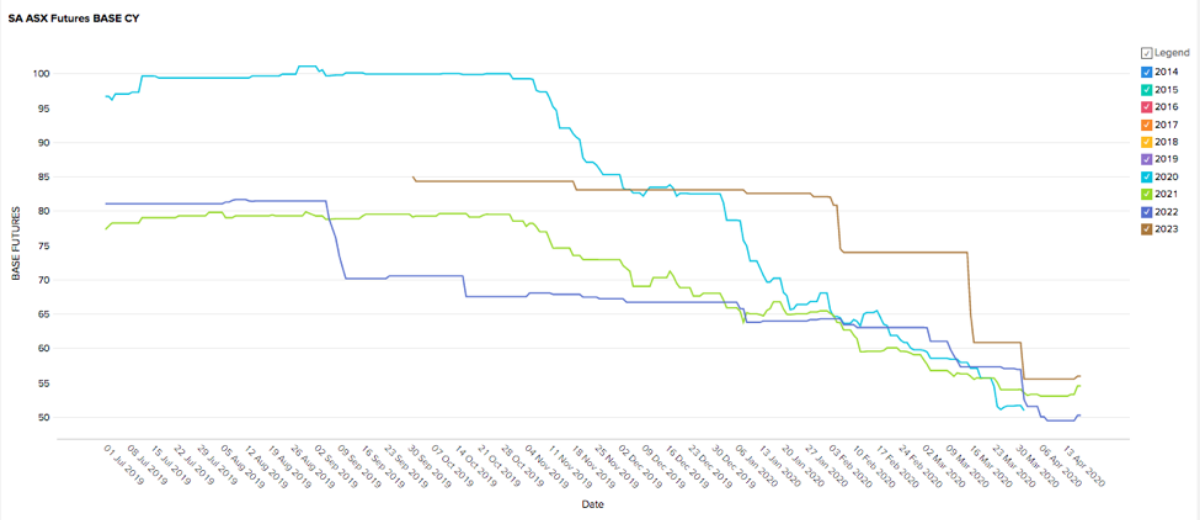
- Futures prices fell at the end of March before flattening out between $50 and $55/MWh for most of April.
- Prices for all years are at all-time lows – a remarkable turnaround for a state renowned for its energy woes and high prices.
How did supply and demand affect price?
- Operational demand is down around 9% on the previous corresponding period.
- Managing very low operational demand during the middle of the day could become challenging for SA’s grid during the COVID-19 lockdown. SA already experienced the lowest operational demand in the NEM’s history last month due to the high penetration of rooftop PV in the state.
- The majority of SA’s energy was supplied by wind and gas with solid wind generation and lower gas prices contributing to soft spot prices.
Indicative retail prices*
| Off-Peak | Peak |
| 4.5c/kWh | 6.5c/kWh |
*Based on offers we have seen in the last week.
The COVID-19 lockdown has arrived at the end of a series of restored outages that materially increased supply in the NEM. While futures markets are pricing in a worst-case scenario demand crash, it is far from clear that this is actually eventuating and even if it does, the lockdown won’t last forever.