January 2019 energy market: National Energy Market future and spot prices soared after parts of Melbourne experienced a blackout over 23-25 January during a particularly brutal heatwave.
The spike in demand caused prices for 2019 and 2020 to shoot up to levels that have not been seen since 12 months ago.
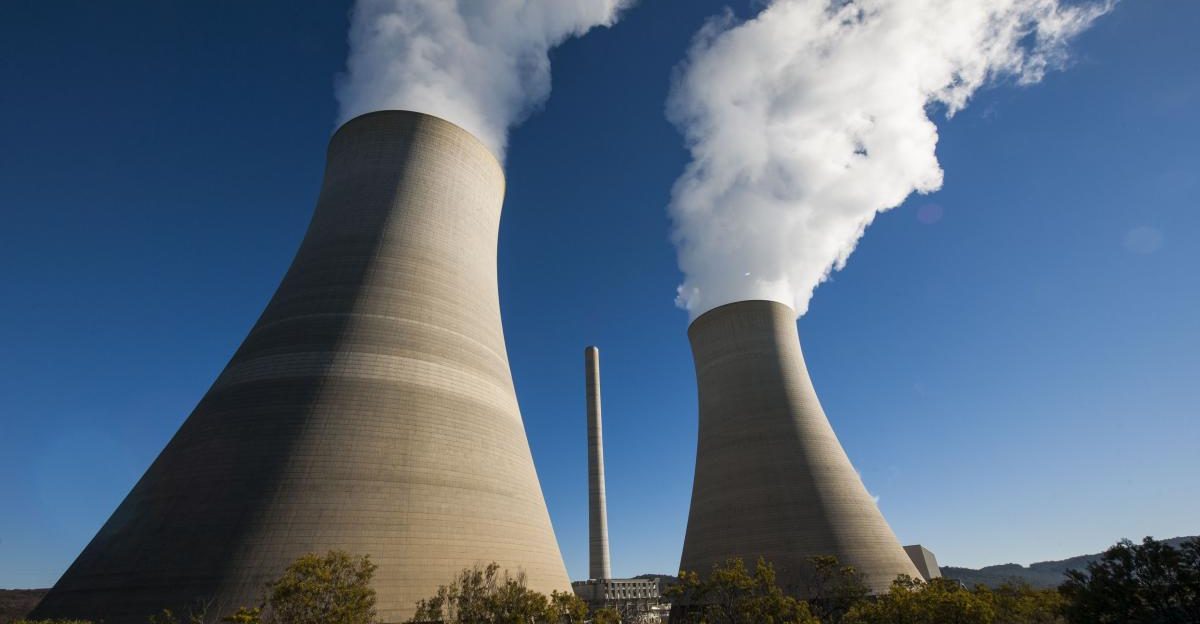
The failure of a number of coal generators and the continued low (although slightly improved) also added to spikes in prices across the NEM.
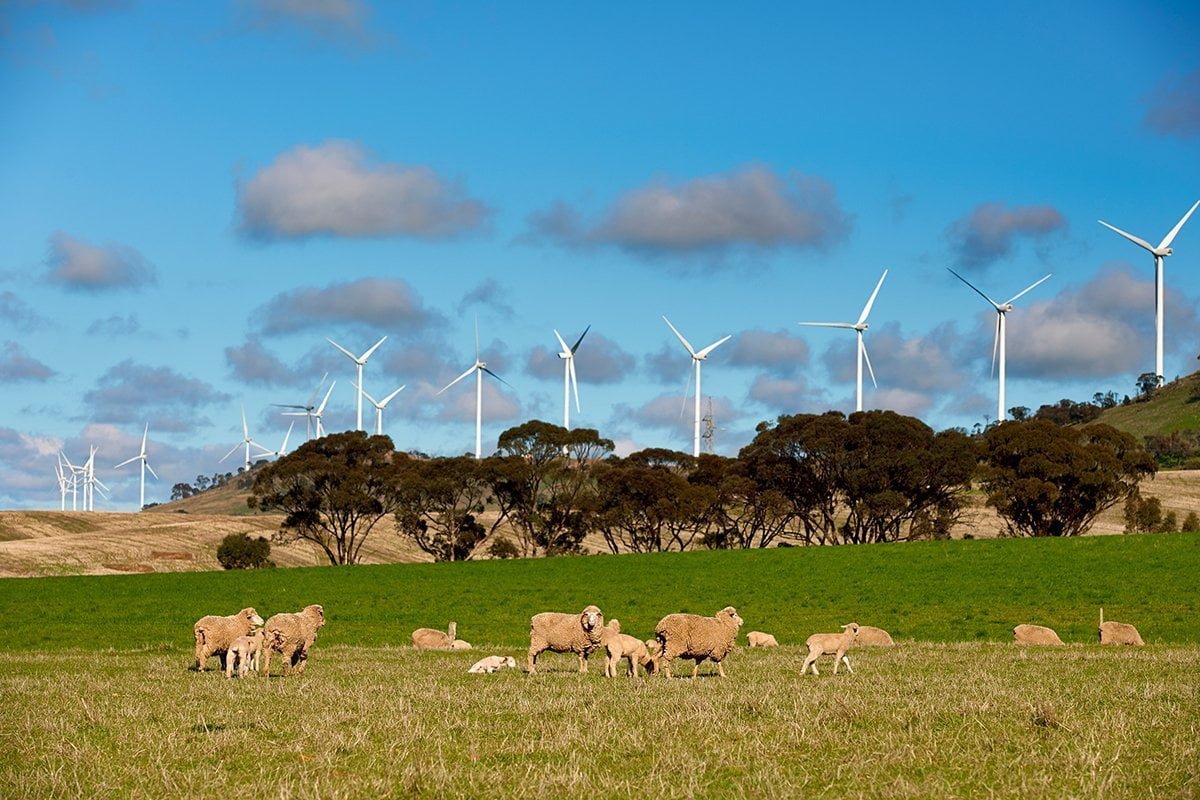
New solar, wind and battery plants continue to come on stream at a fast pace, but the large share of coal and gas generation continues to dictate prices.
The Melbourne blackout
The Australian Energy Market Operator had forecast a 31 percent chance of blackouts in Victoria last September in its Electricity Statement of Opportunities report.
Despite triggering the Demand Response mechanism, AEMO had to order Victoria’s biggest energy user to power down. Even that was not enough and load shedding took place on 25 January.
The fact that three coal units failed during the same period and that Victoria continued to export electricity through the interconnector to New South Wales continued to strain prices.
The heatwave had a big impact on electricity futures prices for 2019 and 2020 in New South Wales, South Australia and Victoria. Queensland was largely spared.
After highs of 11.7 cents per kilowatt hour in Victoria, prices seem to finally be easing off, although they are still considerably high. Buying electricity at future prices for 2019 and 2020 is, at present, expensive.
Hot weather affects the whole NEM
Although Victoria and South Australia grabbed the heatwave headlines, the average temperature in New South Wales was hotter than other regions in the NEM in January.
Average apparent temperatures rose from December by 3.3 degrees in New South Wales, 2.3 degrees in Queensland, Victoria and South Australia.
In all regions except Queensland, maximum temperatures in January 2019 were significantly higher than both December (up to 9 degrees) and January 2018 (up to 8 degrees). Queensland’s maximum was cooler by 4 degrees compared to December.
In Adelaide, the previous temperature record of 46.1 degrees set in 1939, was broken on the 24 January 2019 when the temperature peaked at 46.6 degrees.
Average and maximum demand
Average and maximum demand increased in January in New South Wales, Victoria and South Australia from the previous month:
| State | Average demand | Maximum demand |
| New South Wales | +1,142 MW (15%) | +2,222 MW (20%) |
| Victoria | +439 MW (10%) | +816 MW (10%) |
| South Australia | +210 MW (17%) | 419 MW (16%) |
| Queensland | N/A | N/A |
Supply-side factors
January started well for New South Wales as all large thermal power generators were online and generating energy after a number of outages (planned and unplanned) the previous month.
As a result of the increased generation, prices for 2019 and 2020 were looking quite good at the start of the year.
Average availability in New South Wales increased by 1,300 MW (11 %) from December. Queensland average availability was also 712 MW higher (7%), as was Victoria by 460 MW (6%), and South Australia by 270 MW (10%).
Even though Victoria and New South Wales average availability was higher, there were forced outages at Yallourn and Loy Yang A power stations in Victoria, and Bayswater, Liddell and Eraring in New South Wales.
Snowy Hydro
Snowy Hydro is still affected by drought conditions, with storage levels at Lake Eucumbene only at 26.6% of maximum capacity.
Output from Snowy increased from 164 GWh in December to 238 GWh in January. This is still significantly lower than the January 2018 output of 420 GWh.
NEM Spot Price Outcomes
Average spot prices throughout the month of January were the highest in over a year across all regions.
The highest average monthly price was in Victoria at $252/MWh, a $160 increase from December, followed by South Australia at $243/MWh which was a $151 increase on the previous month.
The maximum price reached in these regions was the market price cap of $14,500/MWh, and in the case of South Australia was sustained for over 3 hours on Thursday 24 January.
February outlook
The tight supply and demand balance in Victoria and South Australia will remain in place for the remainder of summer, with both regions exposed to high spot prices.
Should another extreme heatwave happen, New South Wales may experience tight conditions. Queensland is well supplied with coal and gas generation to offset any spikes in demand.
Prices on the market – especially in New South Wales and Victoria – continue to be affected by the reliability and availability of large coal-fired units. More unplanned outages will lead to higher spot prices particularly on weekdays when summer temperatures climb to extreme levels.
Renewables
Increases in renewable generation from new large scale solar and wind in the NEM continued from the 2018 trend. This additional supply has not led to lower spot price outcomes due to higher priced gas, hydro, and black-coal generation.
Based on the January 2019 energy market, underlying prices are expected to remain strong due to the continuation of high gas prices, and low water storage levels as dry conditions and low rainfall persists across all regions.
Want to find out the best times to tender for energy contracts?
Knowing when to go to the market to purchase energy for your business at future prices is a great way to establish exactly how much you will be paying and for how long.
The key is to know the exact time to go to the market. Our Energy Management Consultants are always plugged into the National Energy Market, as you can see in our January 2019 energy market wrap, and will advise you when the time is right to enter into an energy contract. Call us on tel: 1 300 852 770 or send us an email on hello@leadingedgeenergy.com.au.


