Market wrap: Very mild weather conditions across Australia throughout the months of October and November led to reduced demand across the National Energy Market.
But other factors were at play which resulted in futures prices climbing upwards including low wind generation, a very low output from Snowy, political uncertainty and interconnector constraints.
The substantial drop in output at Snowy (89GWh in October) was a major driver in pushing up futures prices.
In November, the Australian Labor Party also launched its own Energy Policy, should it be elected in 2019.
Labor has stated that it will accelerate the shift away from coal with a goal of 50 percent of power to come from renewable sources by 2030.
An extended period of rain over Eastern New South Wales and South East Queensland resulted in lower rooftop and large-scale solar generation for the period.
Sydney and Melbourne got their first taste of Summer on 1 November as the mercury hit 30 degrees Celsius. The event was a one-off, but is a reminder that high demand periods will soon set in as people turn on their air conditioners.
Supply factors
Average availability of power was similar to that of September’s as outages continued across various large coal generators in New South Wales and Queensland. This is normal for this time of the year, as generators plan outages in this period of reduced demand.
Victoria and South Australia’s availability of power dropped 4 percent while a 13 percent drop in the availability of Tassie’s hydro generators saw a change in flow through the Basslink interconnector. Lower generation from Tassie and Snowy Hydro is a stark reminder of how much hydro impacts peak prices. The uncertainty around hydro availability over the peak Summer period is a key driver affecting the increase in wholesale rates for 2019.
Wind Power

There was lower than usual wind generated in South Australia and Victoria, particularly in the month of October. The trend was reversed in November, however, as sustained periods of strong wind resulted in more power being generated.
During the period of low wind output, prices were pushed up because the NSW-VIC interconnector was constrained.
Solar

Solar generation is adding up to 5000 MW from both small rooftop PV systems and large-scale installations, which has put strong downward pressure on daytime spot prices. Solar generation is on the up as capacity throughout the NEM increases, impacting market and price dynamics.
Hydro
Snowy produced an average of 540 GWh of power between April and August. However, water levels at Lake Eucumbene, Snowy’s largest storage, are only at only 21.1% capacity. This time last year, the lake was 38.8% full. In September, Snowy slowed down to 198 GWh and in October, output was half that at just 89 GWh.
There are no figures available for November yet.
New South Wales
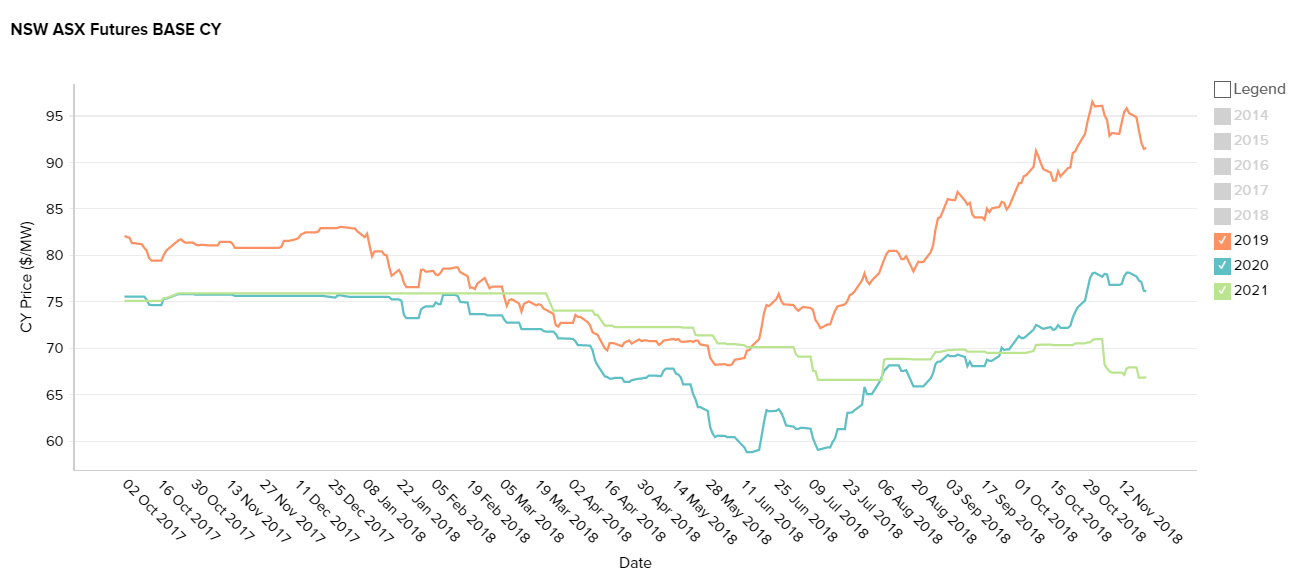
Generation in New South Wales was particularly slow due to outages at black-coal fired power plants. Half of these outages were planned (maintenance etc.) and these do not affect futures prices as they are factored into the production equation. Lower solar generation due to extended rain also affected the situation.
Average Futures price (23 November):
2019: 9.2c per kWh
2020: 7.6c per kWh
2021: 6.9c per kWh
Queensland

Interconnector flows across the NEM were directed towards South Australia and Victoria due to shortages. Planned outages also affected Queensland’s thermal plants while extended rain also reduced solar generation.
Average Futures price (23 November):
2019: 7.8 per kWh
2020: 6.4c per kWh
2021: 5.6c per kWh
South Australia
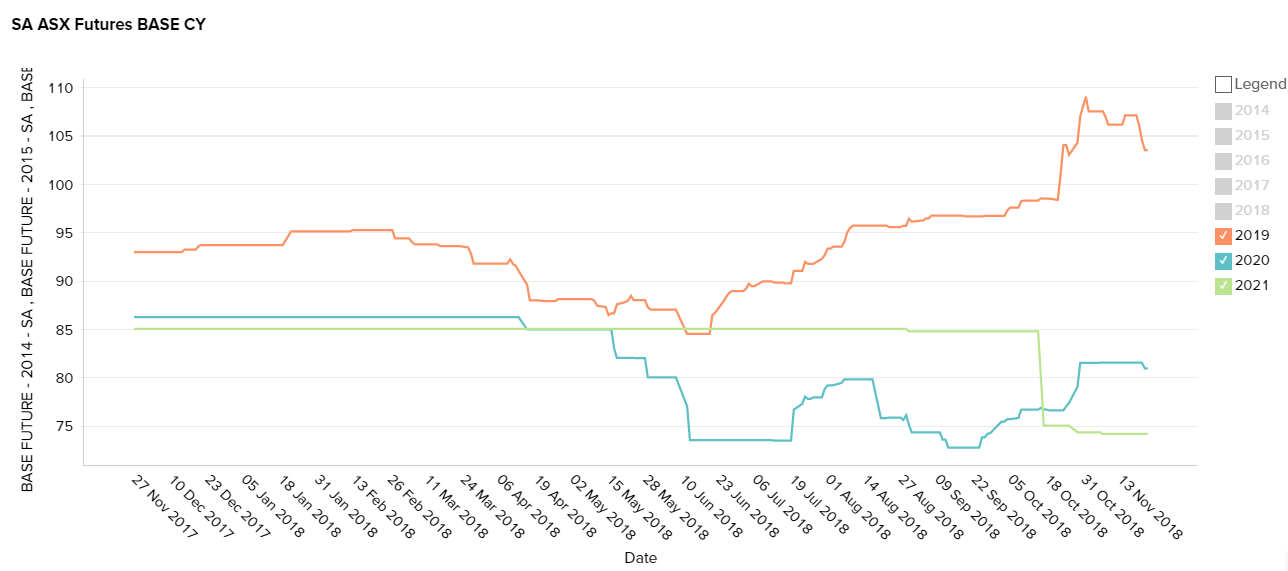
South Australia was affected by low wind generation output during the period under review. Electricity had to be imported through the interconnector. Despite this, South Australia had a record low demand of 580 MW on 20 October.
Average Futures price (23 November):
2019: 10c per kWh
2020: 8c per kWh
2021: 7.4c per kWh
Victoria
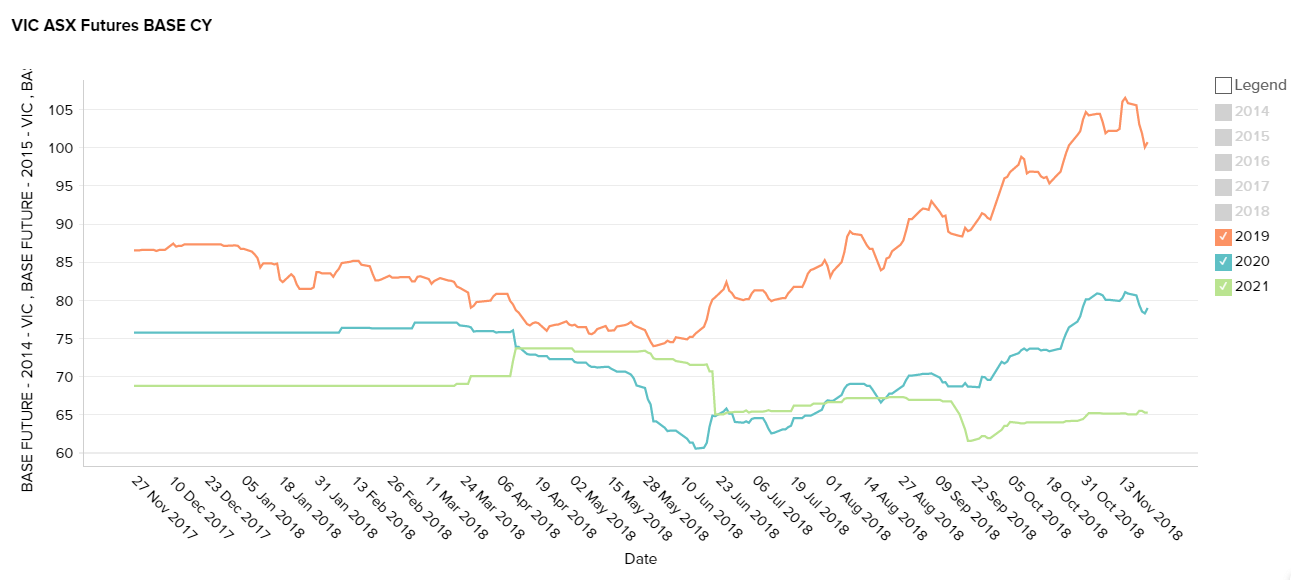
Victoria was also affected by low wind generation and needed to import electricity through interconnectors.
Average Futures price (September):
2019: 10c per kWh
2020: 7.9c per kWh
2021: 6.5c per kWh