The Australian Energy Market Operator’s latest analysis of the National Energy Market has revealed that gas and electricity prices have been driven up to record highs by the cost of producing energy at gas and coal-fired generators.
The Quarterly Energy Dynamics Report covering Q4 2018 also found that while electricity prices remained at comparatively high levels, they were offset by the addition of 800 Megawatts of variable renewable energy sources, bringing the total of renewable energy capacity for 2018 up to 3,000 MW.
Put simply, prices have remained high and would be even higher if it were not for additional solar, wind and traditional hydro.
In practice, this means that businesses which are coming up for energy contracts are getting sledgehammered, especially with retail contracts.
A more cost-effective solution is to purchase energy at futures prices on the wholesale market, which offers the security of knowing exactly what you are paying and for how long.
Highest quarterly gas prices on record
Source: AEMO
AEMO’s analysis found that comparatively high gas prices resulted in gas-powered generators setting the price more often and at higher levels.
Reduced supply from the Longford gas facility in Victoria (-29%), high wholesale electricity prices and record volumes going to liquefied natural gas (LNG), were all contributing factors to the highest quarterly gas prices on record, up 43% from the same time last year.
Inflated gas and electricity prices in AEMO-operated markets were influenced by record high daily pipeline deliveries to Curtis Island for LNG export (3,583 TJ/day).
These domestic gas price results occurred despite a 33% drop in international Brent prices (oil) and a related fall in LNG netback pricing.
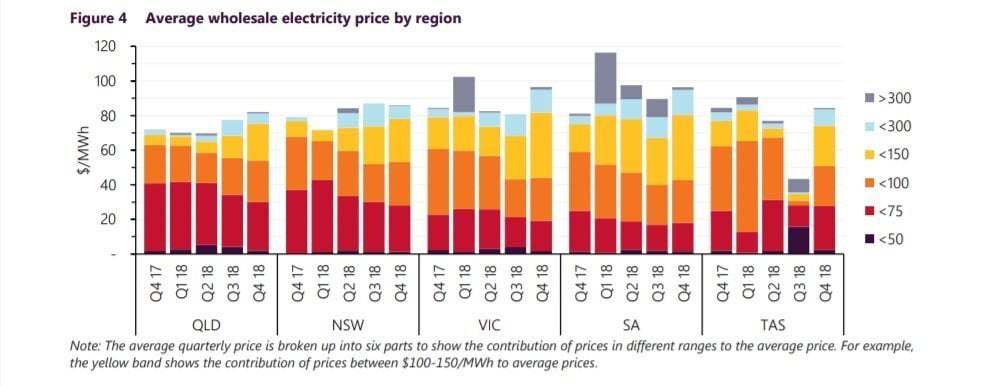
Highest Q4 gas and spot electricity prices on record
Quarterly average NEM spot electricity prices were $82-96/MWh, which is the highest Q4 on record in all regions except Tasmania.
These high gas and electricity prices occurred despite average mainland operational demand for the quarter falling to its lowest level since 2002; and a lack of high spot prices above $300/MWh.
It also pointed to the structural shift of offers from black coal-fired generators to higher prices over a longer term between 2014 and 2018 as well the progressive closure of approximately 4,000 MW of coal-fired capacity between 2013 and 2017.
Coal the dominant price setter
Source: AEMO
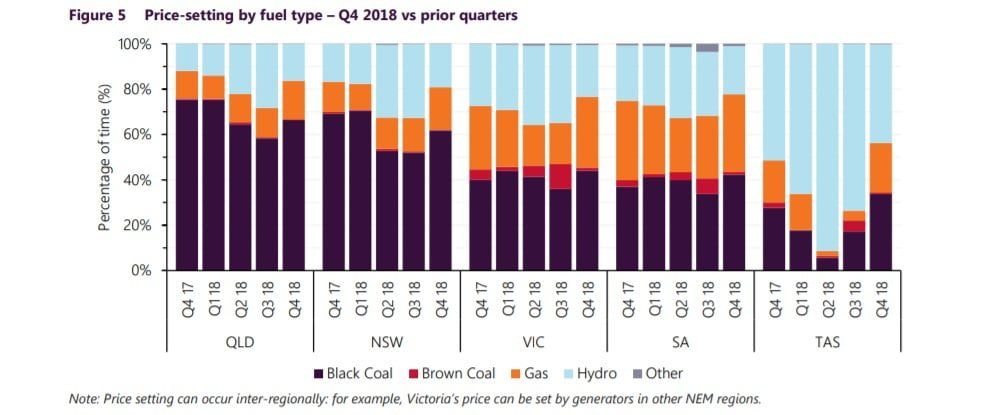
Black coal remained the dominant price-setter in the mainland NEM, particularly in Queensland and New South Wales, where it was the marginal generator more than 60% of the time. In Victoria and South Australia, black coal set the price around 40% of the time. The most frequent price setting power stations were Gladstone (11%), Bayswater (10%) and Stanwell (9%) power stations.
Total brown coal-fired generation during Q4 2018 was 8,227 GWh, representing the lowest quarterly average since market inception. This was due to extended outages at Yallourn and Loy Yang A power stations, with output at these power stations reducing by 666 GWh and 322 GWh respectively when compared to Q3 2018.
Record low brown coal output contributed to Q4 2018 recording the lowest quarterly emissions level since NEM-start. Black coal-fired generation in New South Wales was 420 GWh (3%) higher than in Q3 2018 despite lower electricity demand, driven by higher wholesale electricity prices and increased availability.
The largest increases were at Vales Point and Bayswater power stations (+399 GWh and 284 GWh respectively) which were partially offset by a 486 GWh reduction in output from Eraring Power Station. Output from Queensland’s black coal-fired generation was consistent with Q3 2018 results, with higher wholesale prices balancing the impact of lower availability.
There was also a relatively high number of sudden generator trips when completed to recent quarters, particularly in Queensland and New South Wales. At this stage, however, Q4 2018 results are not indicative of a longer-term trend, with the number of sudden unit trips in 2018 consistent with results in recent years.
The impact of renewable energy
AEMO’s report also delved into changing electricity consumer patterns coupled with the impact of new technologies which resulted in the NEM recording its lowest operational demand since 2002.
This trend was not limited to the NEM. In Western Australia, the Wholesale Electricity Market also recorded one of its lowest demand loads ever at 1,199 MW.
NEM average operational demand has been declining since 2009 which has been influenced by the decline of energy-intensive industries; increased uptake of rooftop PV; and higher uptake of energy efficiency improvements.
Over 3 GW of large-scale renewable energy projects commenced generation in the NEM during 2018, representing a 66% increase in capacity from the start of the year. This contributed to a 34% decrease in spot Large-scale Generation Certificate prices over the quarter.
South Australia continues to blaze a trail in the rooftop solar sphere, recording an all-time low electricity demand of 599 MW at 1 pm on October 21.
Do you want to learn more about wholesale energy contracts?
Our Energy Experts are constantly plugged into the National Energy Market and will advise you on the best time to go to the market.
Call us on tel: 1 300 852 770 or send us an email on hello@leadingedgeenergy.com.au to book your free consultation today.


Speak to an Energy Expert
If you would like to know what the current and forward curve rates are, we can provide you with a forecast. Or have a general enquiry?