Welcome to the first market review of 2022! It has been a subdued summer weather-wise for the eastern states with La Niña dominating temperatures but that hasn’t stopped chaos in the spot and futures markets. Prices are soaring with Queensland and NSW futures prices testing record highs. Surging renewables pushed coal generation to a record low at the close of 2021 however the NEM is still exposed to the international forces driving coal and gas prices up. The loss of generation at Callide C continues to push prices up in QLD and NSW and serves as a reminder to Victoria of the sudden impact one outage can have on electricity prices. We are gearing up for another year assisting our clients to manage their energy costs in a volatile market – reach out to one of our energy experts today.
| INDICATIVE RATES | NSW | VIC | QLD | SA |
| PEAK | 10.48 c/kWh | 6.69 c/kWh | 6.07 c/kWh | 6.70 c/kWh |
| OFF-PEAK | 6.04 c/kWh | 3.79 c/kWh | 4.27 c/kWh | 3.91 c/kWh |
New South Wales
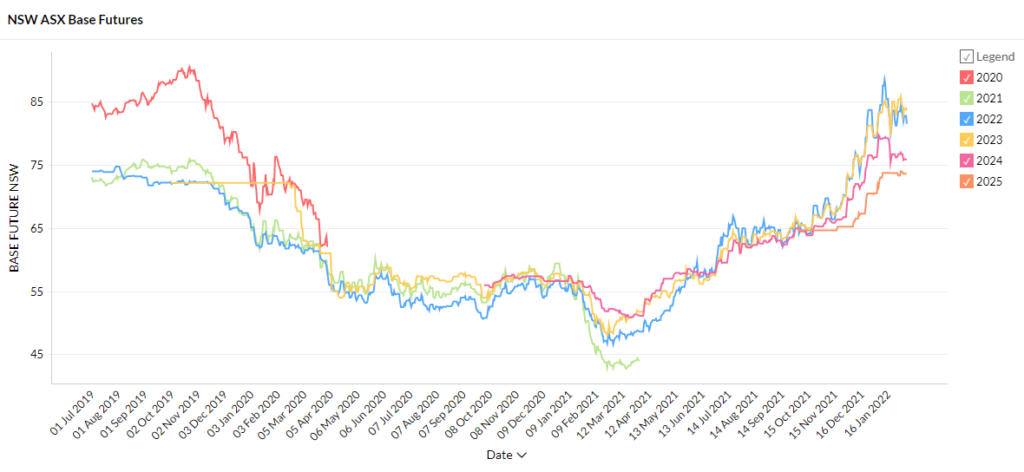
- Futures prices have soared over summer rising as much as 14% since December 1.
- 2022 and 2023 contracts are trading at $83 and $85/MWh respectively, up ~75% on the lows seen early last year.
- 2024 contracts are trading at $77/MWh and 2025 contracts are at $73/MWh, up 16% since they began trading in October.
How did supply and demand affect price?
- Demand was softened by milder temperatures due to La Niña and spot prices ranged from -$1,000 to $1,176 in December and -$322 to $300/MWh in January.
- Spot prices followed a deepening duck curve with the lowest prices seen in the middle of the day and the highest in the evening as solar fades and thermal generators ramp up.
- The volume-weighted average prices (VWAP) were $70 and $77/MWh for December and January respectively.
- The long-awaited closure of the Liddell power station will begin in April with the closure of one out of four units with the rest to follow in 2023. Liddell has not been operating at full capacity for some time so the closure should not materially affect the supply/demand balance in the short term.
Victoria
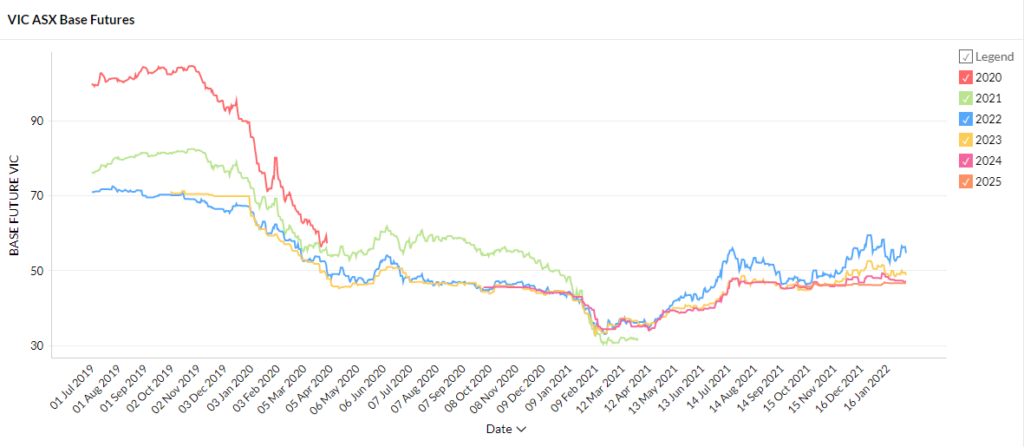
- Victoria has enjoyed the most subdued price rises seen over the summer with contracts for all periods still trading under $54/MWh with 2023, 2024 and 2025 all sub-$50/MWh.
- 2022 contracts almost reached $60/MWh earlier in January before coming back down.
- Prices are still up substantially on the lows seen last March and April when all contract periods were trading below $37/MWh.
How did supply and demand affect price?
- Demand remained soft despite periods of high temperatures in December and January and increased solar supply contributed to the state finishing 2021 with a low market demand record of 2,123 MWh at midday on December 28.
- Surging renewable supply led to 2,700 negative pricing intervals over the two months with prices falling to -$102/MWh. Maximum spot prices were around the $350 mark in both months and the VWAPs were low, $37/MWh in December and $53/MWh in January.
Queensland
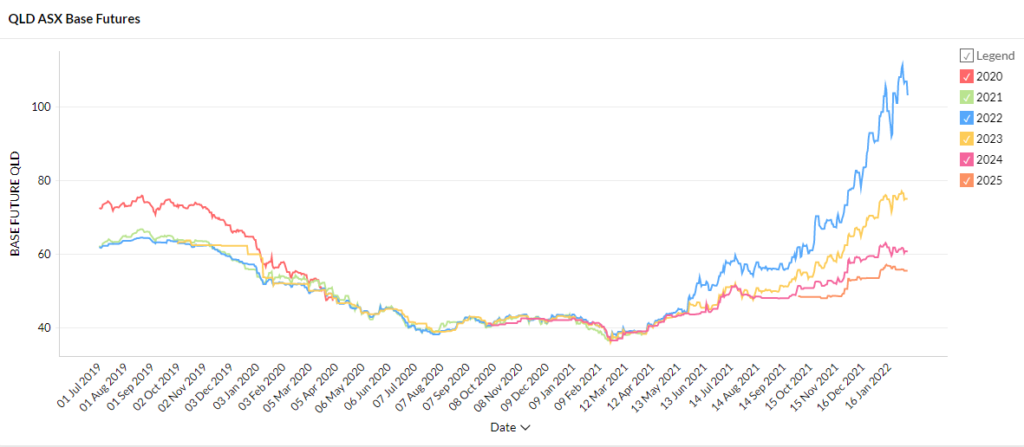
- Queensland 2022 futures contracts have gone through the roof, up 40% since the start of December to trade at $108/MWh. These contracts were available for $37/MWh at the start of last year marking a massive 190% increase in under 12 months.
- Later contract periods are also up although not as much. 2023 contracts are trading at $76/MWh, 2024 at $61/MWh and 2025 $56/MWh marking a clear pattern of decreasing price with time.
How did supply and demand affect price?
- Queensland spot prices soared over the summer with the VWAP reaching $153 and $123 in December and January respectively
- Spot prices peaked above $13,000 in both months and reached $15,000/MWh in January
- High fuel prices for gas and coal affected by global conditions appear to be behind the high prices along with the news that the Callide C’s return has been delayed until 2023.
South Australia
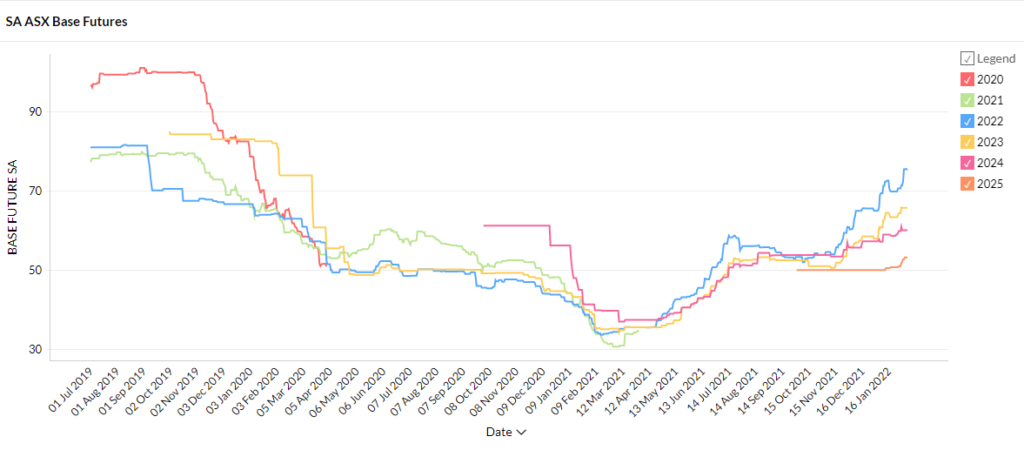
- 2022 contracts rose from $60/MWh to $71/MWh over December and January
- 2023 and 2024 contracts experienced smaller gains to trade at $64/MWh and $60/MWh respectively
- All contract periods were trading sub $38/MWh as recently as April 2021
How did supply and demand affect price?
- SA is continuing to experience extreme volatility in its spot prices with prices jumping between -$1,000 and $15,000/MWh.
- As has been noted previously, SA is reliant on gas-fired plants to support its impressive renewable fleet and is therefore exposed to soaring gas prices. This condition will persist until sufficient battery and interconnector capability are built to displace the need for gas firming.
- SA is also vulnerable to sudden shifts in renewable output such as unexpected cloud cover or a drop in wind that causes thermal generators to have to respond quickly (called the “ramp rate”). Steep ramp rates can drive prices through the roof even when demand is relatively low.
- High prices associated with renewable volatility are of course offset by extreme lows experienced throughout the day (there were over 3000 negative pricing intervals over December and January)
It has been a rocky start to 2022 with futures prices through the roof. Media coverage of falling electricity prices referring to residential markets and renewable records may have fostered a sense of complacency. One glance at futures and spot price charts tell a very different story. Futures markets are now on an eleven-month streak of price rises and the international energy crisis is showing no signs of easing. If you need help managing the impact of rising electricity prices on your business reach out to us now.
Disclaimer: The information in this communication is for general information purposes only. It is not intended as financial or investment advice and should not be interpreted or relied upon as such.