Wholesale electricity futures and spot prices registered a significant uptick mid January before stabilising at the end of the month.
Prices are still almost double what they were this time last year.
Wholesale electricity futures and spot prices tumbled in December following the Federal Government’s price cap on coal and gas in response to the June 2022 crisis.
The start of January remained relatively stable, following a significant uptick in the second week of the month.
Prices again tapered off and returned to what they were at the start of the month.
While the news is welcome to businesses looking to purchase electricity in advance, wholesale prices are still roughly double what they were in December 2021.
Generation and demand across the entire National Energy Market increased somewhat as Australia moves toward the tail end of summer as businesses ramp up their operations.
In other news, the Australian Competition and Consumer Commission has warned that there may be a gas shortage on the East Coast if new gas fields are not tapped into.
AGL Energy’s Liddell power station will be winding down operations during February as it heads towards retirement in April.
The New South Wales government has shortlisted 4.3GW of wind, solar and storage projects in the first renewables auction as the state seeks to replace coal-fired energy that is being retired from the grid.
We realise that this is concerning for businesses. If your business needs help comparing electricity and gas plans, reach out to our energy experts now to lock in an energy cost-reduction and sustainability strategy.
Read more to learn about the electricity market in January 2023.
New South Wales
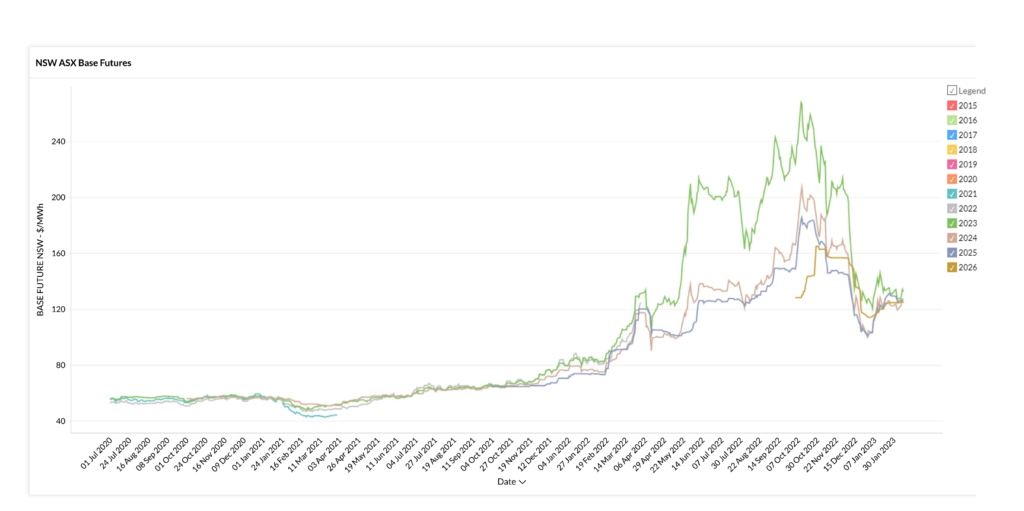
Average Movement Summary:
| Avg Rate Movement Since: | 1-Jan-2023 | 1-Dec-2022 | 1-Nov-2022 | 1-Aug-2022 | 1-Feb-2022 | 1-Feb-2021 |
| NSW – Average | ⇧ 16.18% | ⇩ 24.02% | ⇩ 30.10% | ⇩ 14.98% | ⇧ 62.86% | ⇧ 132.25% |
- 2023 futures started the month at $123/MWh, climbing to $ 146/MWh by the middle of the month and then dropping to $133/MWh to close off January.
- 2023 prices are still much more expensive than at the end of 2021, when prices were $80/MWh
- 2024 contracts followed the same trend starting the month at the lower price of $103/MWh, climbing to $128/MWh by the middle of January and closing off the month at $123.
- 2025 contracts started the month at $103, climbing steadily to $130 by the middle of the month before plateauing and closing at $129.
Commentary:
- Spot prices rose somewhat in January, with the volume-weighted average price (VWAP) at $94 /MWh compared to $83 /MWh the previous month.
- Electricity spot prices ranged from -$199/ MWh to a high of $1,254/MWh, suggesting some volatility. There were eight instances where prices were above $500 and numerous negative pricing incidents.
- Renewables contributed 37% of the state’s energy, down 3% from the previous month. Reliance on gas was higher than last month, up half a percentage point at 1.1%. Coal contribution jumped up to 62%.
- The New South Wales government has shortlisted 4.3GW of wind, solar and storage projects in the first renewables auction as it seeks to replace coal energy that is being retired, such as Liddell, which is set to close in April.
Victoria
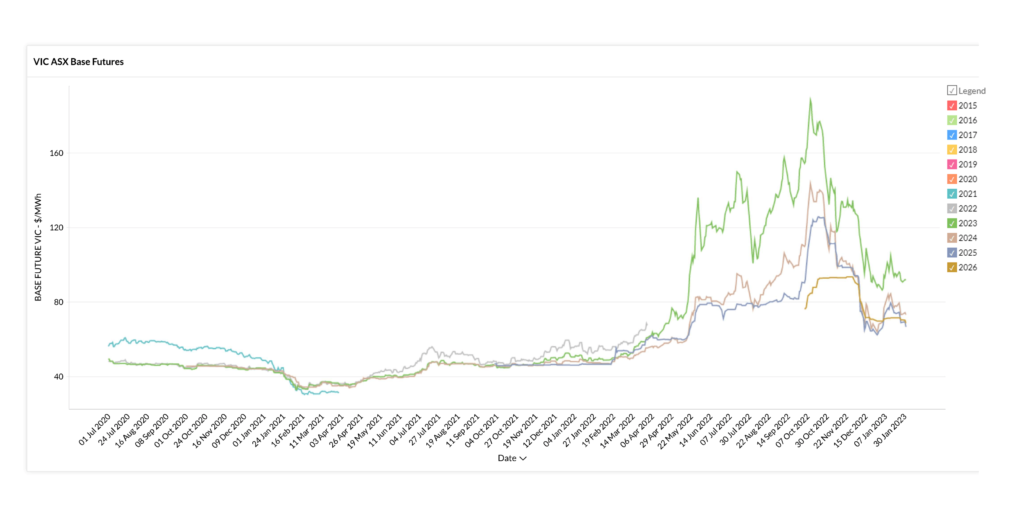
Average Movement Summary:
| Avg Rate Movement Since: | 1-Jan-2023 | 1-Dec-2022 | 1-Nov-2022 | 1-Aug-2022 | 1-Feb-2022 | 1-Feb-2021 |
| VIC – Average | ⇧ 6.70% | ⇩ 25.95% | ⇩ 35.11% | ⇩ 21.73% | ⇧ 64.44% | ⇧ 110.36% |
- 2023 started the month at $86/MWh, climbing substantially to $104/MWh and then dropping to $92/MWh to close off the month.
- At $92/MWh, 2023 futures are $96/MWh cheaper than at the peak of the crisis in October when they tipped $188, but still significantly more expensive than at the end of December 2021 when they were $50/MWh.
- 2024 contracts started the month at $69, climbing to $84 by the middle of January and closing off the month at $73.
- 2025 contracts started the month at $66, climbing to $79, and closing off the month at 65/MWh.
Commentary:
- The spot market increased in price substantially, with the volume-weighted average price (VWAP) coming in at $108 / MWh compared to $31/ MWh the previous month.
- Although the increase was marked, the spot price was less volatile than other states, spanning between -$357 and a high of $367.
- Coal generated 63% of the energy mix, up 3% from the previous month. Renewables supplied the state with 36 % of its power, down 2%. Reliance on gas was very low at 0.5 but increased by half a percentage point to 1% of supply.
Queensland
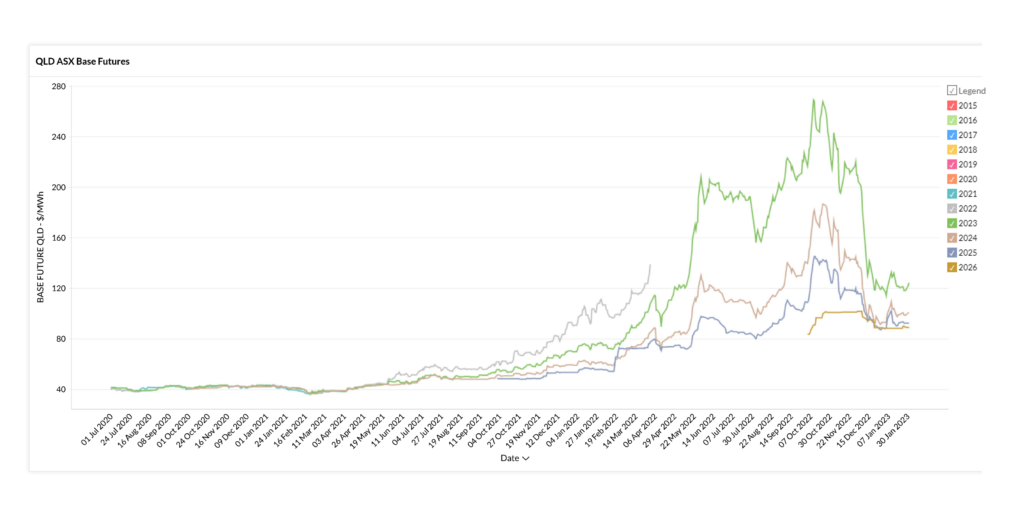
Average Movement Summary:
| Avg Rate Movement Since: | 1-Jan-2023 | 1-Dec-2022 | 1-Nov-2022 | 1-Aug-2022 | 1-Feb-2022 | 1-Feb-2021 |
| QLD – Average | ⇧ 4.45% | ⇩ 30.06% | ⇩ 35.44% | ⇩ 11.75% | ⇧ 62.30% | ⇧ 172.28% |
- 2023 started the month at $ 117/MWh. Similar to NSW and VIC, prices climbed to $132/MWh by the middle of the month, closing at $124/MWh.
- 2023 futures were significantly cheaper than at the height of the crisis when they hit $268/MWh but are still much higher than this time last year when they traded at $69/MWh.
- 2024 contracts started the month at $94/MWh, climbing to $109 by the middle of the month before settling and closing the month at $100/MWh.
- 2025 contracts started the month at $88/MWh climbing to 102 and closing the year at $92/MWh.
Commentary:
- Spot prices rose somewhat in January with the VWAP average rising to $99 / MWh from $86 / MWh the previous month.
- Prices were somewhat unstable, with three market cap incidents at $15,500/MWh. Prices were above $10,000 during five trading intervals. The lowest price spot price on the market came in at -$65 / MWh.
- Renewables supplied 26% of the state’s energy for the month, down 3 percent. The majority came from solar (21%). Coal supplied 67% of demand and gas share increased by 1% to 7%.
- Callide C is not expected to be active until late June 2023, with month-by-month increments to generator capacity. C3, which suffered structural failure is also set to return in May in an incremental manner.
South Australia
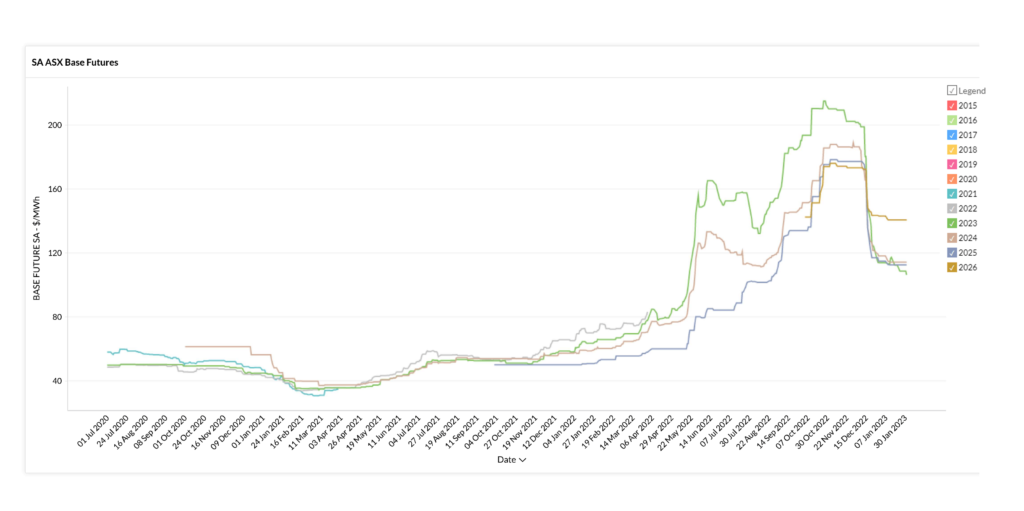
Average Movement Summary:
| Avg Rate Movement Since: | 1-Jan-2023 | 1-Dec-2022 | 1-Nov-2022 | 1-Aug-2022 | 1-Feb-2022 | 1-Feb-2021 |
| SA – Average | ⇩ 3.30% | ⇩ 40.52% | ⇩ 40.85% | ⇩ 6.40% | ⇧ 89.63% | ⇧ 173.61% |
- 2023 Futures prices in SA started the month at $113/MWh, rising slightly to $117/MWh and flatlining at a steady $106.
- 2023 SA futures traded at $207/MWh at the height of the crisis, but are still significantly higher than at the end of December 2021 when they fetched $58/MWh on the market.
- 2024 contracts started the month at $114/MWh and then moved in a straight line till the end of the month closing at $112/MWh.
- 2025 contracts opened at $118 and much like 2024, moved in a straight line to close off the month at $114.
Commentary:
- Average spot pricing climbed somewhat with the VWAP at $67 / MWh up from $36 / MWh the previous month.
- Volatility was high with a high of $12,523/MWh, which is the exact high fetched in December. There were three instances of pricing above $10,000 and 10 instances over $800. The lowest price was $-997.
- Renewables generated a staggering 82% of the state’s energy mix. Wind power accounted for 48% of total generation and solar 35%. Gas generation at 17% was the highest in the NEM and a four percent increase over the previous month.
- South Australia peaked at 91.5 pct wind and solar when links were down to other states.
There is no doubt that Federal Government intervention in the gas market and state intervention in the coal market has driven down electricity prices in all NEM states.
Whether that trend continues remains to be seen but the response in terms of pricing has been encouraging.
Pricing on the international market will continue to be dominated by the war in Ukraine and whether or not a new Russian offensive is mounted in the Northern Hemisphere Spring.
Depending on risk appetite, now could be a good time for businesses to purchase electricity through wholesale tenders.
We hope our January 2023 electricity market review has proven informative and insightful. For more context on the situation in the energy market for the previous months, you may find our monthly energy market reviews here. Reach out to our energy experts to understand your options in these difficult conditions.
Explainer: Why we focus on Wholesale Futures Prices
Wholesale Futures Price: This reflects what the market expects wholesale electricity spot rates to be in future periods. The offers that commercial and industrial (C&I) customers receive via Leading Edge Energy are closely correlated to wholesale prices on the ASX Energy futures market and this is why we focus on these prices in our commentary.
Spot Price: This represents how much the spot market is charging for electricity currently based on demand and supply. Spot prices go up when demand is high and supply is tight. You can view live Spot Prices here.
You can learn more about the difference between wholesale electricity futures and spot prices in our blog section.
Disclaimer: The information in this communication is for general information purposes only. It is not intended as financial or investment advice and should not be interpreted or relied upon as such.
Interested in getting personalised energy efficiency and cost reduction advice for your business? Your People in Power are ready to help
Get Started Here