What a difference 12 months can make. This time last year the NEM was enjoying the lowest prices on record, thermal generators were threatening to shut down supply in response to the low prices, renewables were booming and system outages were minimal. Fast forward to today and prices are soaring – in some cases up over 220% on last year. The Callide C outage was the first domino to fall followed by the news that Origin would close Australia’s largest coal-fired power plant 7 years early. In the last month, the world has been rocked by the Russian invasion of Ukraine which has sent coal and gas prices through the roof. NSW and QLD have been the hardest hit with renewables and brown coal shielding South Australia and Victoria from global forces to some extent. Check out our interactive tools to gain more insights about energy supply in the NEM. Victorian futures prices are still sub $70/MWh compared to the northern states which are trading as high as $130/MWh.
Call our energy experts now to secure your contract before it’s too late.
| INDICATIVE RATES | NSW | QLD | VIC | SA |
| PEAK | 13.25 c/kWh | 11.07 c/kWh | 6.40 c/kWh | 10.04 c/kWh |
| OFF-PEAK | 7.78 c/kWh | 7.11 c/kWh | 3.96 c/kWh | 5.00 c/kWh |
New South Wales
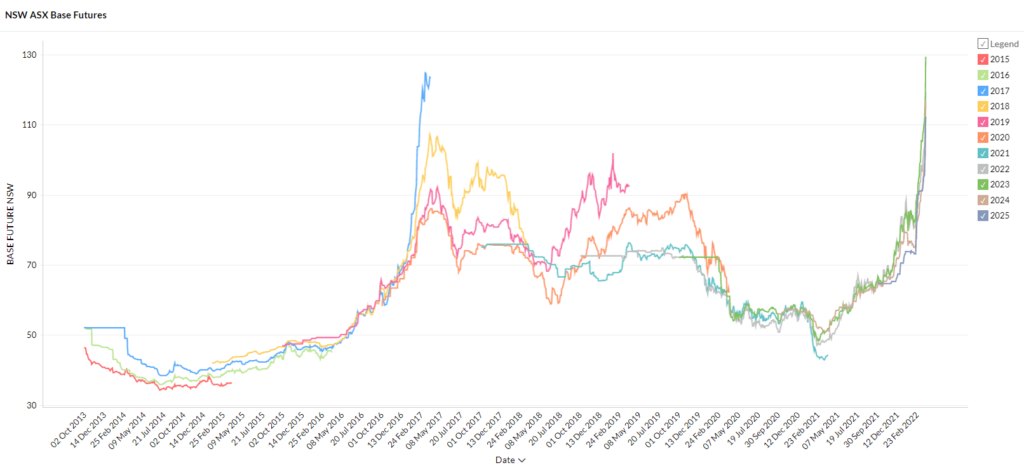
- Futures prices have soared to record-breaking levels.
- 2023 contracts are trading at $129/MWh up 36% since the start of the month and a massive 160% in 12 months.
- 2022 contracts aren’t far behind at $119/MWh after trading sub $50 at the same time last year.
- 2024 and 2025 contracts are trading at $116 and $112/MWh respectively.
- NSW futures contracts have only been above $100/MWh on a handful of occasions in the last 7 years.
How did supply and demand affect price?
- The volume weighted spot price continued its climb reaching $99/MWh for March. The high was $8,574/MWh and the low was -$87/MWh against soft demand.
- Skyrocketing coal and gas prices driven by the Russia Ukraine conflict are the dominant force behind high spot prices.
- Demand for non-Russian coal has seen export shipments leaving NSW fetching up to $564 a tonne compared to $67 a tonne in 2020.
- The stronger than expected La Niña has likely dampened solar output in NSW with above average rainfall across most of the state.
Victoria
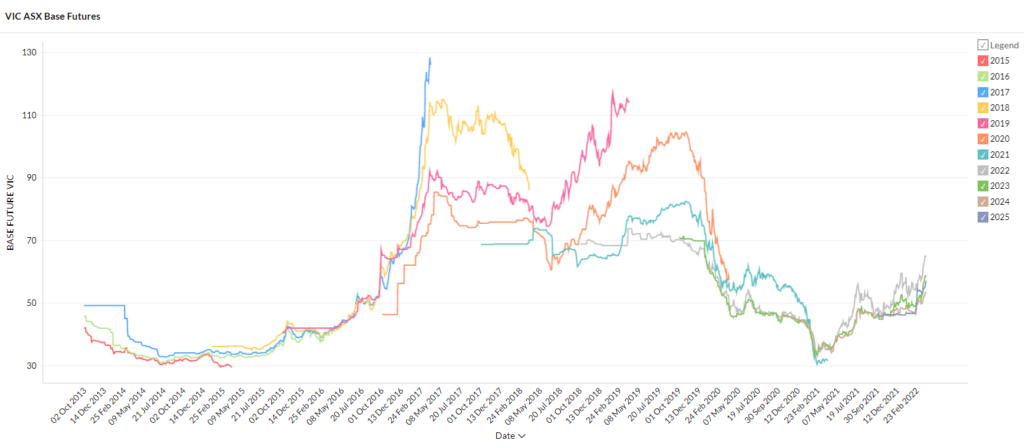
- Futures prices have risen across all contract periods but gains have been mild compared to other states.
- 2022 prices are the highest at $65/MWh.
- 2023, 2024 and 2025 contracts are trading between $53 and $59/MWh.
- Although well up on February’s sub-$45/MWh lows Victoria’s prices are still a far cry from its soaring northern neighbours.
How did supply and demand affect price?
- Victoria enjoyed low spot prices with over 1000 negative pricing intervals and a range of -$176 to $320/MWh and VWAP of $59/MWh.
- Renewables supplied 33% of Victoria’s demand over the month sheltering the state from higher fuel prices.
- Brown coal supplied the remaining 67% also shielding it from the Russia induced energy crisis since brown coal is not suitable for the export market (no one wants it).
- The Basslink interconnector suffered its first outage in some time. In this instance it was restored quickly and had the effect of driving Victorian prices down (and Tassies up); the disruption serves as a reminder of the NEM’s reliance on interconnectors (and their frequent failures).
Queensland
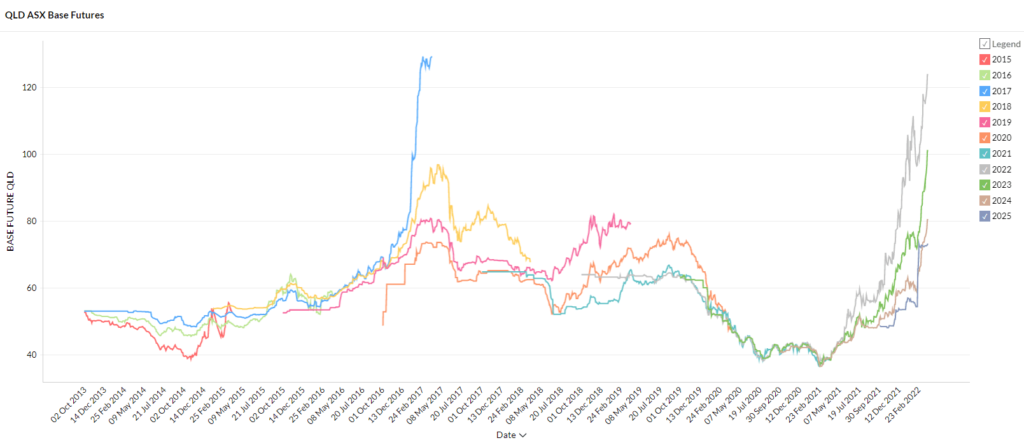
- Queensland is continuing to be smashed with skyrocketing prices.
- 2022 contracts have exploded 226% over the last 12 months to $124/MWh adding 19% in March.
- 2023 contracts are trading at $101/MWh, 2024 at $80/MWh and 2025 contracts are the cheapest at $73/MWh.
- All contracts were below $40/MWh at the same time last year.
How did supply and demand affect price?
- Queensland is being hit with pressure on both the demand and supply side.
- Demand reached an all time record of 10,119MW at 5:30pm on March 8 and has frequently been high since March.
- Rising demand is adding to the state’s woes as the Callide outage squeezes demand, the energy crisis pushes up fuel prices and the early closure of Eraring threatens further supply shortages from 2025.
- The VWAP for March was a massive $174/MWh with 10 intervals hitting the $15,100/MWh ceiling.
South Australia

- All contract periods are up roughly 100% on 12 months ago but are still well below NSW and QLD levels.
- 2022, 2023 and 2024 contracts are trading between $70 and $78/MWh with the latter years cheaper.
- 2025 contracts are lower at $57/MWh.
How did supply and demand affect price?
- Renewables supplied 63% of the month’s supply, shielding the state from the unfolding global energy crisis.
- Imports and gas supplied the remainder, driving spot prices up, reaching above $10,000/MWh on two occasions.
- High prices continue to occur between 4 and 6pm as solar fades and thermal generation and imports ramp up.
When prices fell to record lows last year there seemed to be an expectation in the market and the media that high electricity prices were a thing of the past. The last few months have shown us that this is clearly not the case. Australian electricity markets continue to be extremely sensitive to outages and although booming renewable supply is reducing our exposure to international fuel prices we are a long way from being able to insulate ourselves from global events. The next few years are shaping up to be a bumpy ride as the energy transition picks up pace. Our Energy Experts are always available to help you plan for the road ahead.
Disclaimer: The information in this communication is for general information purposes only. It is not intended as financial or investment advice and should not be interpreted or relied upon as such.