The downward trend in electricity futures markets is continuing in March with 2023 prices now at all-time lows in all states. South Australia hit its lowest operational demand in the history of the National Electricity Market with behind-the-meter solar being the contributing factor.
The anticipation of a drop in energy demand due to COVID-19 might be starting to creep into 2020 prices with modest reductions in the National Electricity Market.
In NSW and VIC, 2023 prices represent excellent value as there will be significant retirements of the thermal fleet. Which are likely to squeeze supply, Act now to lock in prices.
New South Wales
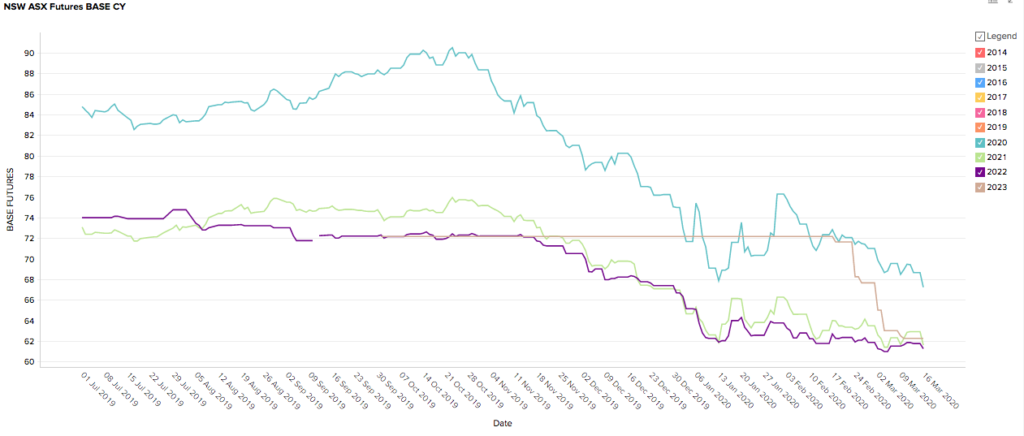
- 2023 futures plunged 16% from $74 to $62/MWh since late February.
- 2023 has converged with 2021 and 2022 prices which seem to be finding a bottom around $62/MWh.
- 2020 prices continued to slide to $67/MWh, down 6% from last month.
How did supply and demand affect the price?
- With milder temperatures and a welcome reprieve from the extreme weather events of summer, March has seen a return to stability on the NSW spot markets.
- Spot prices ranged from $1.33 to $169/MWh while demand peaked at 11,344MW.
- It is not clear where the sudden bout of optimism over 2023 supply is coming from since Liddell is still slated to close in April 2023, investment in renewables is collapsing, and there is no clear plan to replace the dispatchable power and other grid services Liddell provides.
Baseload Futures Price March 17 2020
| 2020: | 6.7c per kWh |
| 2021: | 6.2c per kWh |
| 2022: | 6.1c per kWh |
| 2023: | 6.2c per kWh |
Indicative retail prices*
| Off-peak | Peak |
| 7.5c per kWh | 5.5c per kWh |
Queensland
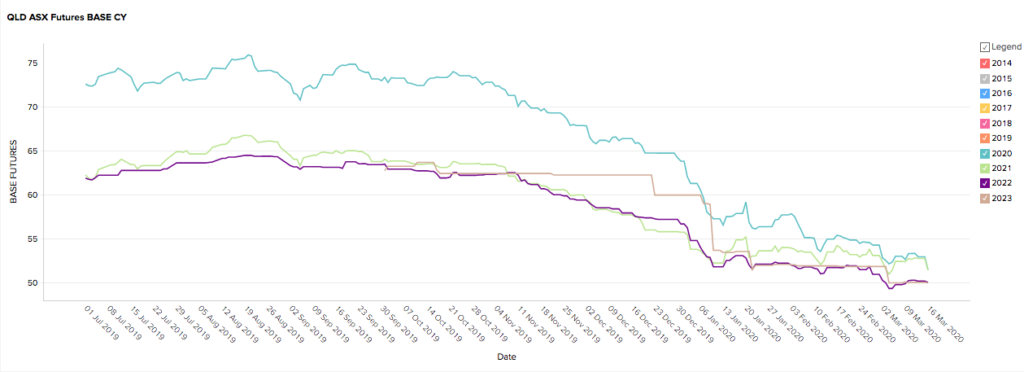
- Futures prices have remained relatively stable and very low throughout March. Prices have not been this low in Queensland since 2016.
- 2020 and 2021 prices dipped to $51/MWh on the 15th and are converging with 2022 and 2023.
- 2022 prices dipped below $50/MWh briefly at the beginning of March.
How did demand and supply affect prices
- Queensland is continuing to enjoy plentiful supply and stability in the system with no major outages.
- Milder Autumn temperatures kept demand down.
- Strong output from renewables and lower gas prices contributed to low spot prices.
Baseload Futures Price March 17 2020
| 2020: | 5.1c per kWh |
| 2021: | 5.1c per kWh |
| 2022: | 5c per kWh |
| 2023: | 5c per kWh |
Indicative retail prices*
| Off-peak | Peak |
| 6.3c per kWh | 4.5c per kWh |
South Australia
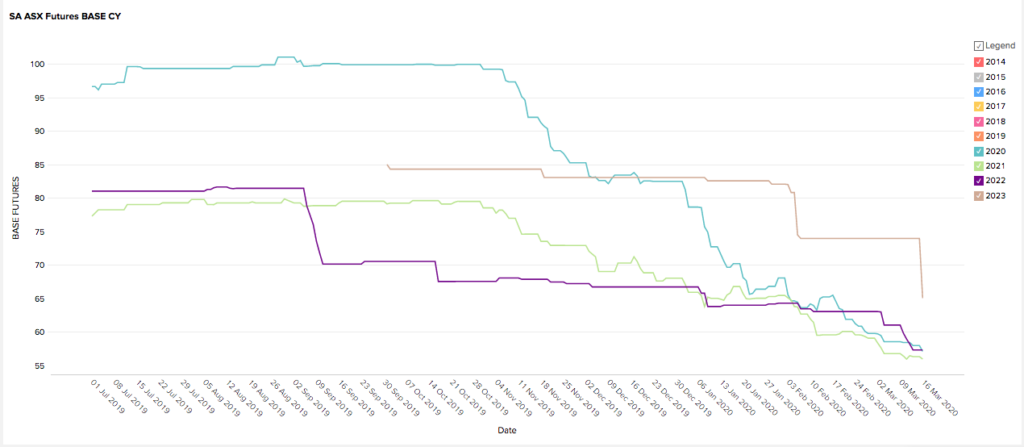
- SA’s 2023 prices fell 11% from $73 to $65MWh on March 16 bringing the total fall to 20% since early February.
- 2020, 2021 and 2022 prices are consolidating in a tight band between $55 and $57MWh.
How did demand and supply affect the price?
- Probably the biggest news to come out of the NEM this month was the drop in operational demand in SA to the lowest levels since the NEM’s inception.
- Operational demand fell to 389 MW on March 9 at 2 pm. This suggests that an increasing proportion of SA’s actual day time demand is being met by behind-the-meter solar.
- The drop in 2023 prices indicates the market is more confident in SA’s longer-term energy outlook after uncertain few years.
- SA is still only connected to the NEM via two temporary lines one of which failed on March 2 sending prices soaring above $5000 MWh for 1 hour.
Baseload Futures Price March 17 2020
| 2020: | 5.7c per kWh |
| 2021: | 5.6c per kWh |
| 2022: | 5.7c per kW |
| 2023: | 6.5c per kW |
Indicative retail prices*
| Off-peak | Peak |
| 8c per kWh | 5.5c per kWh |
Victoria
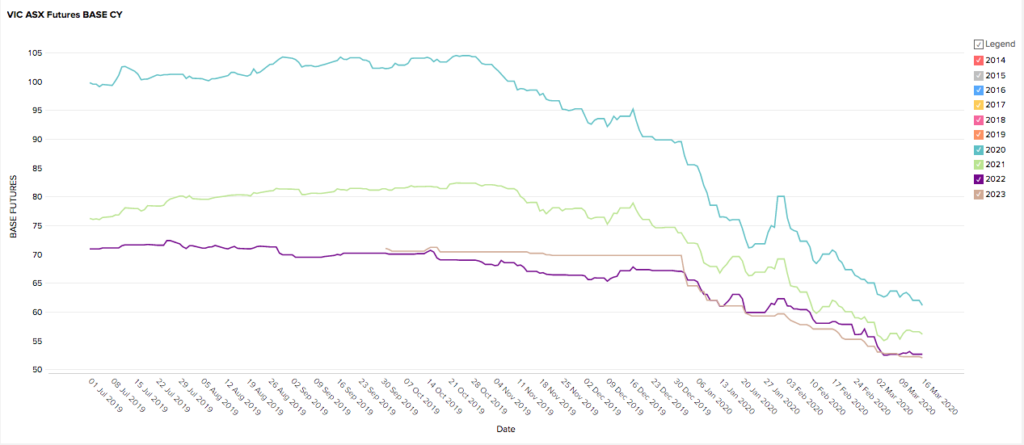
- 2020 prices have recovered from the bushfire-induced spike in February and resumed the downward trend that began in November 2019 following the reinstatement of the Basslink Interconnector.
- Prices for all periods are between $61 and $52/MWh and it hasn’t been this low since early 2017.
How did supply and demand affect the price?
- Demand remained flat, peaking at 6298 MW due to milder Autumn temperatures.
- Restoration of the connection to SA on March 3 (albeit by a temporary line) marks the first time since June 2019 that Victoria’s energy system has been operating without a major disturbance (i.e.: Basslink, Mortlake, Loy Yang A, the bushfire/heatwave crisis and loss of the SA-VIC connection).
- With all cylinders firing Victoria is enjoying low/stable spot prices and a generally more optimistic market outlook.
Baseload Futures Price March 17 2020
| 2020: | 6.1c per kWh |
| 2021: | 5.6c per kWh |
| 2022: | 5.3c per kWh |
| 2023: | 5.2c per kWh |
Indicative retail prices*
| Off-peak | Peak |
| 6.7c per kWh | 4.8c per kWh |
We hope you have found this market review useful. There are bargains to be had in all states for all time periods. 2023 prices appear to be overly optimistic given the challenges the grid will face between now and then.
Lock in low prices now!