Summer is on our doorstep and it’s official – it is going to be a wet one. The Bureau of Meteorology announced this month that we are in a La Niña. The weather system is associated with above-average rainfall and risks of storm and flooding. The conditions will likely dampen solar output over summer but will also reduce demand due to milder temperatures. This month has seen volatile spot prices and rising futures contracts in most states as the opposing forces of surging renewable capacity and soaring gas prices pull the market to extreme highs and lows. As always we are here to help. Check out our ever-popular interactive market analysis tools to keep track of the changes and reach out to our energy experts for advice.
| INDICATIVE RATES | NSW | QLD | VIC | SA |
| PEAK | 8.98 c/kWh | 7.90 c/kWh | 6.51 c/kWh | 6.40 c/kWh |
| OFF-PEAK | 5.81 c/kWh | 4.71 c/kWh | 3.70 c/kWh | 3.61 c/kW |
New South Wales
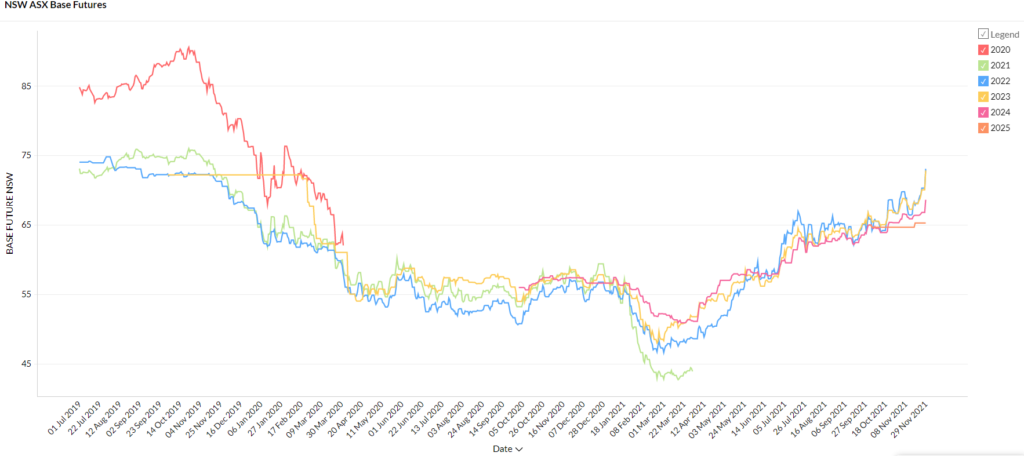
- Futures contracts are trading between $65 to $71/MWh, prices haven’t been this high since March 2020.
- 2022 and 2023 contracts are the most expensive with both trading around $70/MWh.
How did supply and demand affect price?
- Spot prices have been high with five intervals priced above $14,000 MWh and 84 intervals priced above $150 MWh.
- Interconnector constraints between NSW and QLD are largely to blame along with high gas prices.
- East coast natural gas prices have almost doubled over November as demand for exports soared and reduced output from the Langford gas processing plant in Victoria due to maintenance squeezed supply.
Victoria
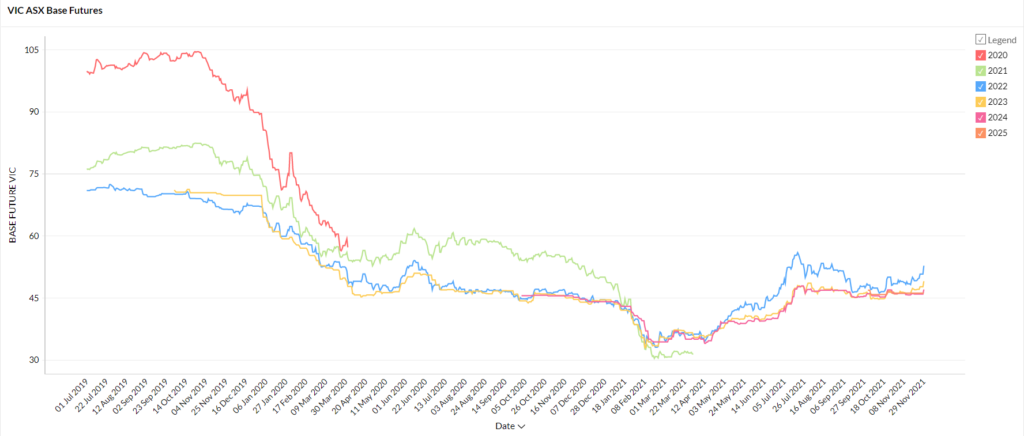
- Victorian futures prices have largely been flat throughout November, trading between $45 and $51/MWh.
- Only 2022 contracts have seen an increase of 6% from $48 to $51/MWh.
- Prices are up nearly 40% on March’s lows.
How did supply and demand affect price?
- Soft demand and solid wind output reduced Victoria’s exposure to high gas prices with gas supplying just 0.4% of November’s generation.
- Spot prices were very low with 1,335 pricing intervals priced at zero or below (falling as low as -$1,000/MWh).
- Wind, hydro, solar and batteries supplied 32% of the state’s energy needs for the month of November contributing to the low prices.
Queensland
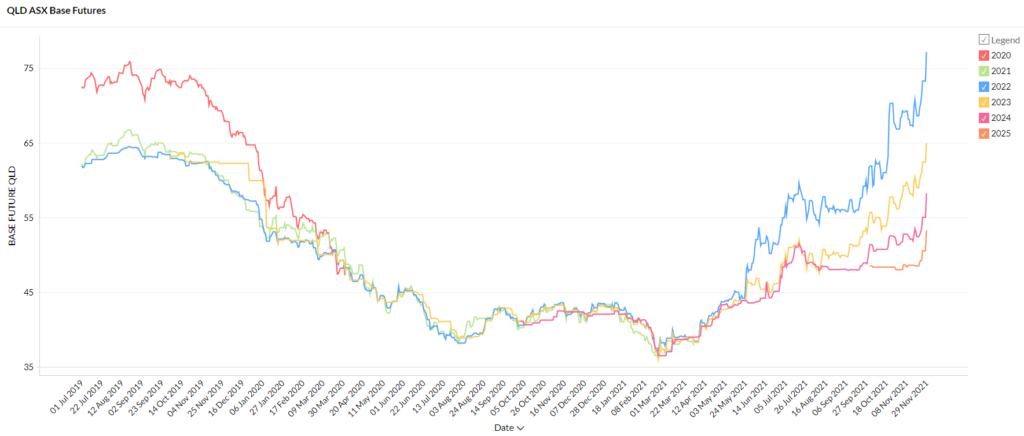
- Queensland futures contracts are soaring with significant rises for all contract periods.
- 2022 contracts have been the hardest hit with contracts almost doubling since February from $37 to $73/MWh.
- 2024 and 2023 are trading at $55 and $62/MWh respectively, up from $35-$36/MWh in late February.
- 2025 contracts which began trading in October are up ~5% to $50/MWh.
How did supply and demand affect price?
- Spot prices were highly volatile from -$1,000 to $15,100/MWh as the state’s grid grappled with high gas prices, an interconnector constraint, solar output ramping up into summer and the continued impact of the Callide C outage. Queensland has been hit by soaring gas prices with the state relying on gas for 8% of its state’s energy needs in November.
- Gas spot prices in Brisbane reached $14/GJ in Brisbane, up from an average of $8.50/GJ last month driven by global demand for LNG exports.
- An Energy Quest report shows Australian LNG exports hit a record 7.23 million tonnes shipped in October. Increased LNG exports have a dual effect in Queensland of squeezing supply and increasing demand on the grid as the LNG industry consumes more power.
- Heading into summer Queensland is likely to be impacted by the La Niña weather system which will bring increased rain and potentially higher storm activity.
South Australia
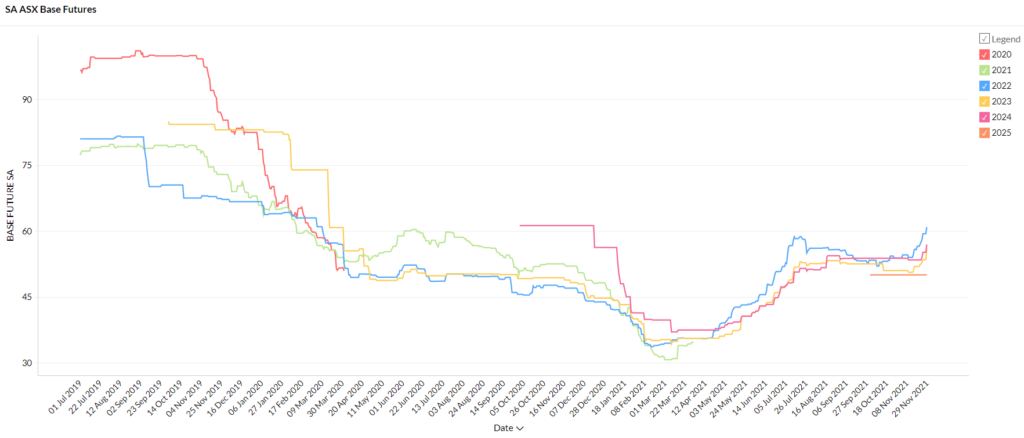
- After flatlining since July, SA’s futures contracts began to rise in the second half of November.
- 2022 contracts rose 10% in 10 days from $54/MWh to $59/MWh, 2023 rose 6% to $53/MWh over the same period.
- The later years 2024 and 2025 were relatively unscathed trading at $55 and $50/MWh respectively.
How did supply and demand affect price?
- South Australia is highly exposed to gas prices with the state relying on the fuel to support its renewables fleet. In November gas supplied 30% of SA’s fuel mix however an abundance of cheap renewables kept spot prices from spiking
- Back in August we wrote about the introduction of synchronous condensers into SA’s grid and this month they are being (partially) credited with a world record. SA’s operational demand fell below zero and wind and solar averaged 108% of demand for a two day period in November.
- Good wind and solar conditions obviously contributed to the outcome but importantly the condensers allowed gas generation to be dialled back by replacing the grid services that could previously only be supplied by a thermal generator.
As we head into a soggy Christmas break the Australian energy transition is marching on. The wet conditions may prevent our expanded solar fleet from reaching its full generation potential this year but demand will likely also be softened by the weather. High gas prices are forecast to continue highlighting the fuel’s vulnerability to global market forces. South Australia’s performance on the other hand has given us a glimpse of what is possible when strategic infrastructure investments are made to support increased renewable capacity. If you would like to head into the new year with an energy plan that protects your business from price volatility, reach out to our team today.
Disclaimer: The information in this communication is for general information purposes only. It is not intended as financial or investment advice and should not be interpreted or relied upon as such.