The Labor Federal Government is reportedly in the advanced stages of instituting a price cap on domestic gas as it tries to put downward pressure on electricity prices.
In the last budget, Treasurer Jim Chalmers forecasted that electricity prices will increase by 56 percent and gas by 40 percent over the next two years.
The problem of intermittency, when the sun is not shining and the wind is not blowing, is compounding the effects on gas prices.
When demand is high and supply is tight, spot gas prices go through the roof, and the cost to generate electricity at high gas-peaking plants increases dramatically.
The move comes as the G7 nations seek to impose caps on Russian oil and gas and further sanctions in retaliation to the invasion of Ukraine.
Electricity spot prices provided some relief this month, as did future contracts. The prices of both fell, in some cases substantially, after the record highs registered in mid-October.
The Federal Government also delivered its budget for 2022–23, forecasting retail electricity price rises of 20% this year and 30% in 2023–24.
Meanwhile, South Australia is now paying the highest prices for electricity in the country. Severe storms led to the shutting down of the interconnector to Victoria, resulting in the state being completely isolated from the national electricity grid for a whole week.
On Sunday, November 6, 2022, the National Energy Market registered its lowest-ever operational demand at 11,730MW, down from the previous record of 12,113 MW on 25 September 2022.
Big solar also set a record during this month, generating 5,247MW on Friday, November 22.
Victoria’s Labor Party won the state election and will implement a 95 percent renewable energy target by nationalising the energy market.
If your business needs help comparing electricity and gas plans, reach out to our energy experts now to lock in a strategy for the summer.
Read on to find out what happened in the electricity market in November 2022.
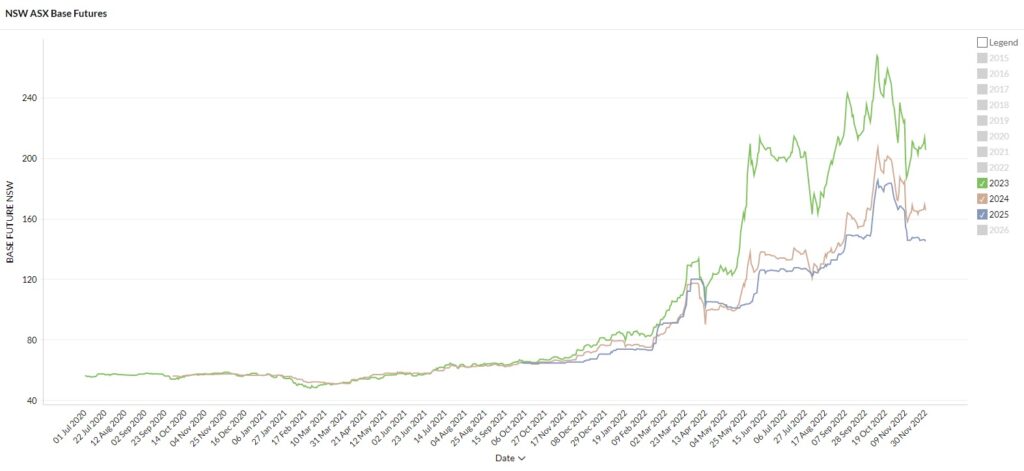
New South Wales
Average Movement Summary:
| Avg Rate Movement Since: | 1-Dec-2022 | 1-Nov-2022 | 1-Oct-2022 | 1-Jul-2022 | 1-Jan-2022 | 1-Jan-2021 |
| NSW – Average | ⇩ 12.61% | ⇩ 19.34% | ⇩ 16.91% | ⇩ 0.26% | ⇧ 97.31% | ⇧175.37% |
- 2023 futures started the month at $210/MWh, climbing sharply to $236/MWh at the end of the first week of November. Prices dropped drastically to $187/MWh before climbing slowly but surely to round out the month at $205/MWh.
- 2024 contracts followed the same trend starting the month at the lower price of $172/MWh, dropping to $158/MWh and closing off November at $165.50.
- 2025 contracts started the month at $166, dropping sharply to $146 and remaining stable until the end of the month, closing at $145.
Commentary:
- Spot prices dropped significantly in November with the volume-weighted average price (VWAP) at $113/MWh compared to $151.65 /MWh the previous month.
- Electricity prices ranged from -$80/ MWh to a high of $14,450/MWh, suggesting some volatility. There were only three instances where prices were above $500 but there were numerous negative pricing incidents.
- Renewables contributed 39% of the state’s energy, up from 31% the previous month. Reliance on gas was even lower than last month at 1%. Coal contribution dropped by around 8% to 60%.
- Many factors driving high prices have eased considerably, however, the Northern Hemisphere is now moving into winter, and global demand for coal and gas exports will soar due to the continuing crisis in Ukraine.
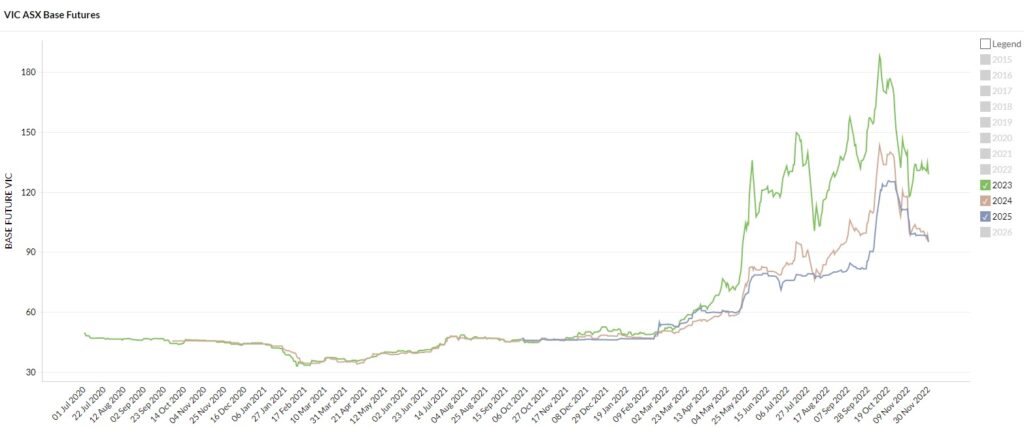
Victoria
Average Movement Summary:
| Avg Rate Movement Since: | 1-Dec-2022 | 1-Nov-2022 | 1-Oct-2022 | 1-Jul-2022 | 1-Jan-2022 | 1-Jan-2021 |
| VIC – Average | ⇩ 16.47% | ⇩ 26.56% | ⇩ 24.35% | ⇧ 0.74% | ⇧ 84.52% | ⇧ 117.95% |
- 2023 started the month at $132/MWh, down significantly from October’s opening of $157 per MWh. Prices climbed to $146/MWh before tumbling to $117/MWh and then climbing back up to $129/MWh to close off the month.
- 2024 contracts started the month at $108, spiking to $121 at their highest and dropping significantly to $95, the cheapest they have been since July.
- 2025 contracts started the month at $90 rising sharply to $125, and closing off the month at 95/MWh.
Commentary:
- The spot market dropped drastically, with the volume-weighted average price (VWAP) coming in at $59 / MWh compared to $99/ MWh the previous month.
- The spot price compared to the previous month was less volatile in Victoria, spanning between -$466 and $321.
- AGL’s Loy Yang A returned to service in the fourth week of October after months of being offline and the lower prices could be attributed to increased supply.
- Coal generated 56.7% of the energy mix, down from 60% the previous month. Renewables supplied the state with 42.5 % of its power, up from 38%. On one day, wind accounted for up to 41% of generated energy. Reliance on gas was very low at 0.6 percent of supply.
- The Victorian Labor Party has been re-elected and is set to implement renewables targets of 95 percent by 2030 and nationalise the state’s energy supply.
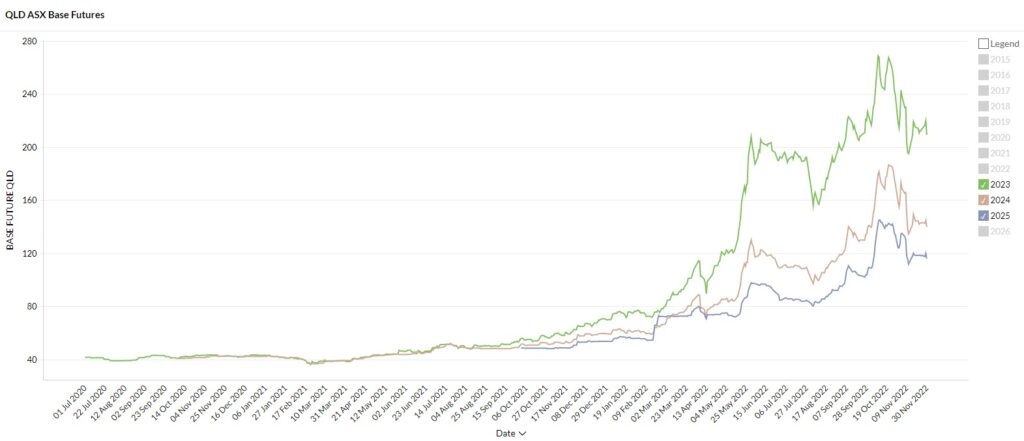
Queensland
Average Movement Summary:
| Avg Rate Movement Since: | 1-Dec-2022 | 1-Nov-2022 | 1-Oct-2022 | 1-Jul-2022 | 1-Jan-2022 | 1-Jan-2021 |
| QLD – Average | ⇩ 13.81% | ⇩ 20.28% | ⇩ 13.88% | ⇧ 8.04% | ⇧ 115.21% | ⇧ 240.29% |
- 2023 started the month at $ 214 per MWh. Similar to NSW and VIC, rose sharply to a high of $242/MWh before dropping sharply to $209/MWh.
- 2024 contracts started the month at $155 /MWh, climbing to $173 at their highest and ending the month at $140 / MWh.
- 2025 contracts started the month at $124 / MWh rising to $135 / MWh and falling again to close off November at $116.
Commentary:
- Spot prices dropped somewhat with the VWAP falling to $122 / MWh from $154 / MWh the previous month.
- Prices were volatile, ranging between -$79 / MWh and one $15,500 / MWh market cap and one instance of $15,125 and one of $12,999 / MWh.
- Renewables supplied 29% of the state’s energy for the month, up 5%. The majority came from solar (25%). Coal supplied 64 % of demand and gas 7%.
- CS Energy’s Callide B has returned to service, but Callide C is not expected to come online until at least February-March 2023.
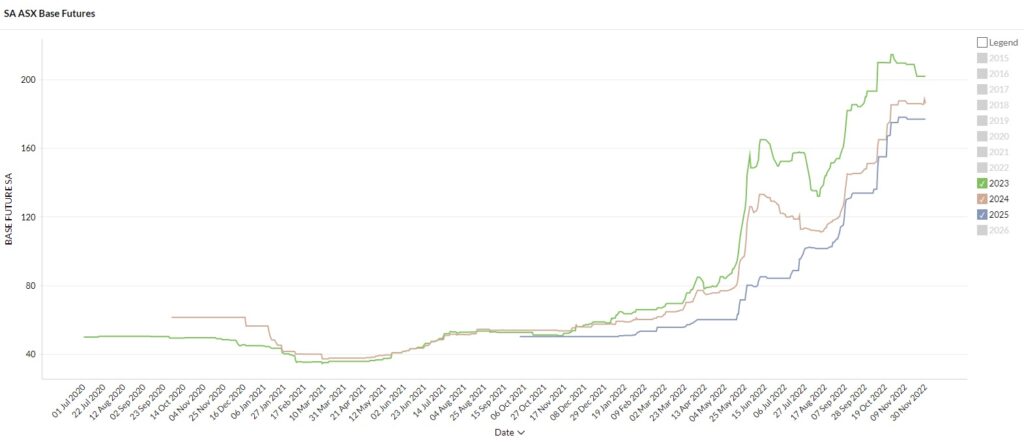
South Australia
Average Movement Summary:
| Avg Rate Movement Since: | 1-Dec-2022 | 1-Nov-2022 | 1-Oct-2022 | 1-Jul-2022 | 1-Jan-2022 | 1-Jan-2021 |
| SA – Average | ⇩ 0.99% | ⇩ 1.68% | ⇧ 18.85% | ⇧ 62.62% | ⇧ 239.11% | ⇧ 285.48% |
- Futures prices in SA followed a different trend from the rest of the NEM and SA is now the most expensive state in the country. That being said, prices were stable and were more or less a straight line.
- 2023 contracts started the month at $210/MWh, remaining settled for the month and dropping slightly to $202/MWh to close the month.
- 2024 contracts started the month at $185/MWh and, with just a couple of wobbles, closed the month at $186.
- 2025 contracts started the month at $175 / MWh, rising to $177 to close off November.
Commentary:
- Spot prices in South Australia moved all over the place during November due to the isolation incident, which saw the state cut off from the rest of the grid for a week.
- Average spot pricing still eased significantly with the VWAP falling substantially to $63 / MWh from $93 / MWh the previous month.
- Volatility was high with three market caps of $15,500 and 7 incidents with prices above $10,000/MWh. There were also numerous incidents of negative pricing with 31 occasions when prices were between -$900 and -$1000.
- Renewables generated 77% of the state’s energy mix. Wind power accounted for 48 percent of total generation, contributing 74 percent on Tuesday, November 1. Gas generation at 22% was the highest in the NEM. On Sunday 20 November, 94 percent of demand was met by renewables.
- South Australia will also have to foot the bill to keep AGL’s Torrens gas plant open for another three years to prevent electricity shortages. Delays to the new SA to NSW interconnector compound the situation.
As the November 2022 electricity market review shows, the market trends last month continued downwards in general following the largest downward correction of futures contracts registered in October.
Prices did climb at one point, but in New South Wales, Queensland, and Victoria, spot and futures prices eased somewhat.
South Australia, with its heavy reliance on renewables and gas to fill any shortfalls, told a different story.
The Administrative Price Cap for energy has been doubled from $300/MWh to $600/MWh following the extreme pricing events that triggered an energy crisis last July. Rather than release energy, generators held back as it was simply not profitable to do so.
After lobbying by generators, the price cap has now been raised. It is being regarded as a temporary measure that runs until 2025.
The Australian Energy Market Operator has addressed concerns about transmission infrastructure by releasing its “Engineering Roadmap to 100 Percent Renewables” report, which we will discuss in our blog and insights section later this month.
All in all, the markets are still nervous and jittery with the northern hemisphere winter and geopolitical risks driving anxiety over coal and gas prices. We continue to help our clients manage price volatility through a range of strategies.
We hope our November 2022 electricity market review has proven informative and insightful. For more context on the situation in the energy market for the previous months, you may find our monthly energy market reviews here. Reach out to our energy experts to understand your options in these difficult conditions.
Explainer: Why we focus on Wholesale Futures Prices
Wholesale Futures Price: This is based on expectations of average future spot prices. If supply is expected to be tighter in the future, this will raise contract prices. The offers that commercial and industrial customers receive from Leading Edge Energy are wholesale futures prices reflected in kWh rather than MWh.
Spot Price: This represents how much the spot market is charging for electricity currently based on demand and supply. Spot prices go up when demand is high and supply is tight. You can view live Spot Prices here
Disclaimer: The information in this communication is for general information purposes only. It is not intended as financial or investment advice and should not be interpreted or relied upon as such.
Interested in getting personalised energy efficiency and cost reduction advice for your business? Your People in Power are ready to help
Get Started Here