On October 31, the National Energy Market registered the biggest daily drop in futures prices in its history.
Just 16 days before, the NEM had recorded the biggest jump upward in forward prices. But on the last day of the month, the forward price for the next 3 calendar years of 2023, 2024, and 2025 across the main regions of Queensland, New South Wales, and Victoria registered the largest daily fall in history.
The closest rival to this price decline was in the second half of 2007 as the market emerged from the coincident drought across the east coast of Australia, however, they do not compare with the magnitude of the decline experienced last month.
Spot prices remained in line with last month’s levels, but after July’s crisis, they are still much higher than the first six months of the year.
Renewable energy set a new record on Friday, 28 October at 12:30 pm, generating 68.7 percent (18,882MW) of energy. The top three contributors were rooftop solar, wind, and utility-grade solar.
Futures markets for 2023 registered sharp upticks in most NEM states but retreated towards the end of the month to slightly lower levels than the previous month.
Like spot prices, futures prices in all states are much higher than prices registered in Q1 and Q2 of 2022. Fuel price concerns continue to dominate the outlook. The northern hemisphere winter is expected to drive demand for coal and gas exports through the roof as Europe looks for alternatives to Russian gas.
The Federal Government also delivered its budget for 2022–23, forecasting retail electricity price rises of 20% this year and 30% in 2023–24.
During a subsequent COAG Energy Ministers meeting, it was agreed that Australia must accelerate the transition to renewable energy to offset the projected increase in electricity prices.
Victoria’s Labor Party has set a 95 percent renewable energy target if re-elected and will nationalise the energy market. South Australia is also considering bringing generation assets back under state control.
We realise that this is a particularly troubling situation for businesses. If you need help comparing electricity and gas plans, reach out to our energy experts now to lock in a strategy for the summer.
Read more to learn about the electricity market in October 2022.
New South Wales
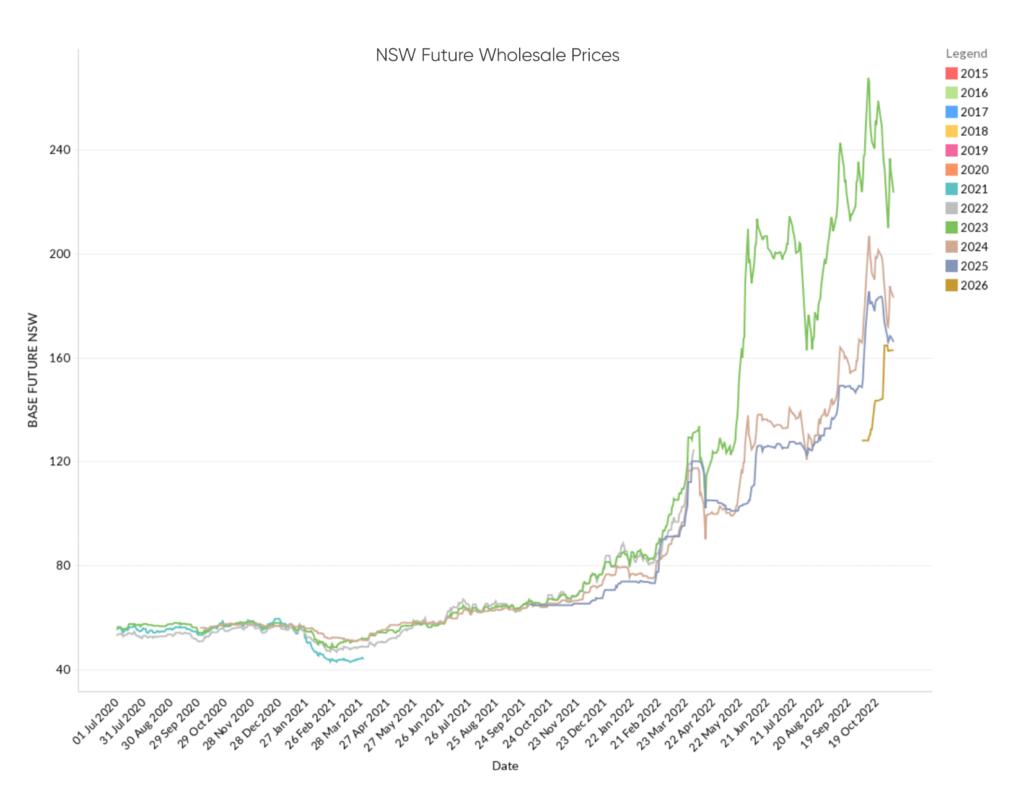
- 2023 futures spiked to $267/MWh in the second week of October, up from $232 / MWh at the start of the month. They dropped significantly to $215 / MWh in the last week of the month.
- 2024 contracts experienced an increase, finishing the month at $172 / MWh, climbing from $166 at the start of October. Prices spiked in the second week before dropping sharply.
- 2025 contracts experienced an increase of $19 per MWH from $149/ MWh at the start of the month, closing at $168 / MWh.
How did supply and demand affect price?
- Spot prices dropped slightly in October with the volume-weighted average price (VWAP) from $154/MWh last month to $151.65 /MWh.
- Electricity prices ranged from -$120 / MWh to highs of $13,811/MWh suggesting some volatility.
- Renewables contributed 31% of the state’s energy, and reliance on gas was very low – just 2%. Coal contributed 67 percent of the mix, in line with last month.
- Many factors driving high prices have eased considerably, however, the Northern Hemisphere is now moving into winter, and global demand for coal and gas exports will soar due to the continuing crisis in Ukraine.
Victoria
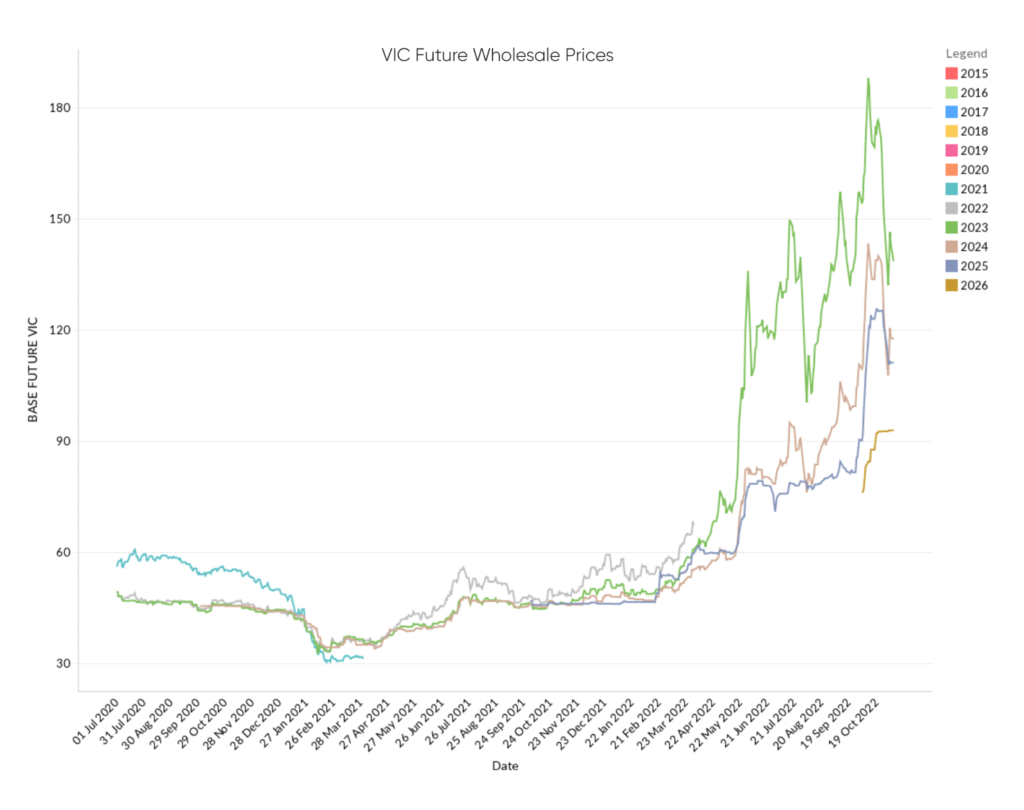
- 2023 started the month at $157 per MWh. Following the same trend as NSW, Victorian contracts jumped $31 to $188 / MWh in the second week of October. They dropped quite dramatically to $137 / MWh at the close of the month.
- 2024 contracts started and ended the month at $110, but spiked to $143 at their highest.
- 2025 contracts started the month at $90 rising sharply to $115, higher than 2024 prices.
How did supply and demand affect price?
- The spot market dropped quite significantly with the VWAP coming in at $99 / MWh compared to $111 / MWh the previous month.
- The spot price was also volatile in Victoria, spanning between -$996 and $584.
- AGL’s Loy Yang A returned to service in the fourth week of October after months of being offline. The retirement of this power plant has been brought forward by 10 years to 2035.
- Coal generated 59.9 percent and renewables supplied the state with 38 % of its power. On some days, wind accounted for up to 38% of generated energy. Reliance on was very low at 1.5 percent of supply.
- The Victorian Labor Party set lofty renewables targets of 95 percent by 2030, looking to nationalise the state’s energy supply in partnership with Super Funds. This all depends on whether the party is re-elected in next month’s state poll.
Queensland
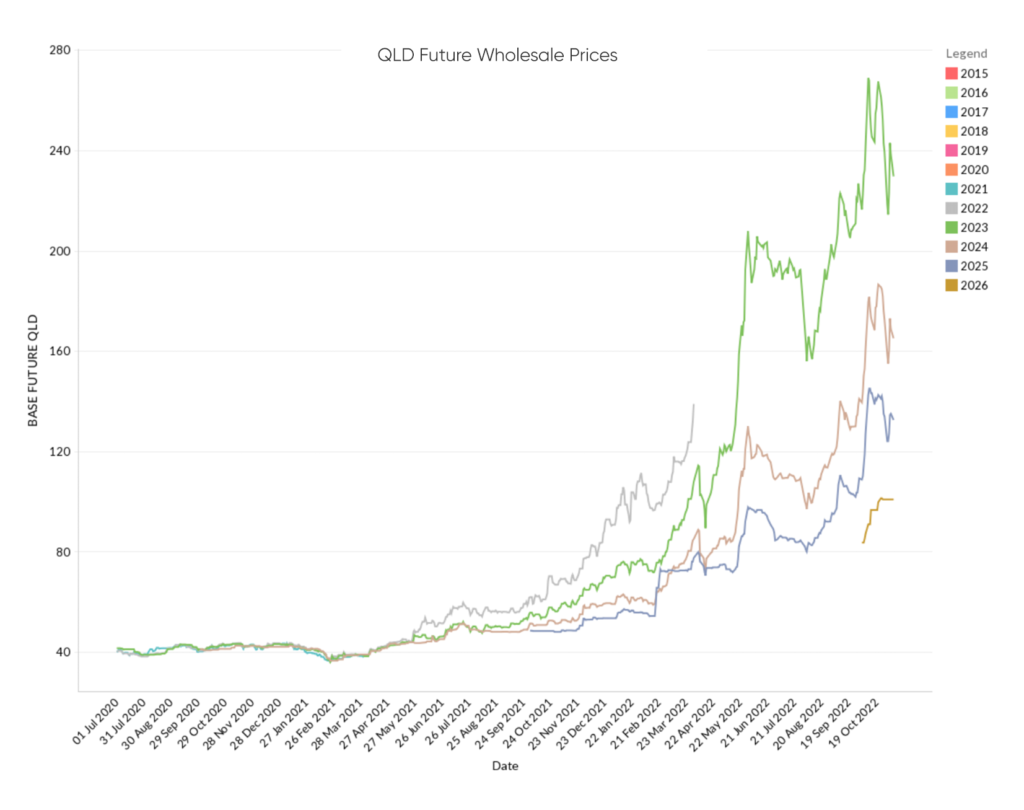
- 2023 started the month at $ 224 per MWh. Similar to NSW and VIC, rose sharply to a high of $268 / MWh before dropping sharply to $218 / MWh.
- 2024 contracts started the month at $141 / MWh and ended the month at $158 / MWh, up 11%.
- 2025 contracts started the month at $109 / MWh rising to $124 / MWh to close off October.
How did supply and demand affect price?
- Spot prices dropped marginally with the VWAP falling to $154 / MWh from $157 / MWh the previous month.
- Prices were volatile, ranging between -$109 / MWh and one $15,500 / MWh market cap and one instance of $12,999 / MWh.
- Renewables supplied 24% of the state’s energy for the month with the majority coming from solar (19%). Coal supplied 69 percent of demand and gas 7 percent.
- CS Energy has extended the overhaul period for its 750 MW coal-fired Kogan Creek plant to 18 December. Callide C4 which was damaged in an explosion in May 2021 is not expected to be back in action until April 2023. Callide C3 suffered a structural failure on 31 October and is expected to return to service on 21 November
South Australia
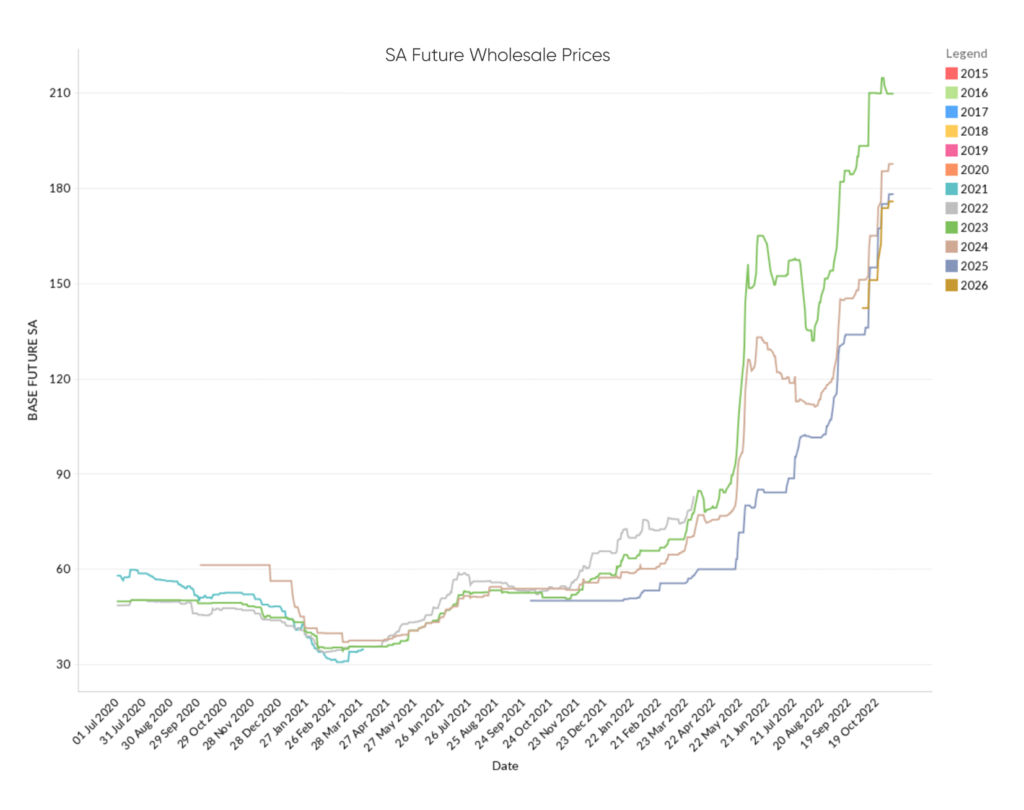
- Futures prices in SA followed a different trend from the rest of the NEM. Prices climbed, plateaued and rose again in a recurring pattern.
- 2023 contracts started the month at $194 / MWh, climbing and settling around the $209 / MWh mark.
- 2024 contracts started the month at $150 / MWh and ended the month at $185 / MWh, a 19 percent increase.
- 2025 contracts started the month at $133 / MWh rising to $175 to close off September, a 31 percent jump.
How did supply and demand affect price?
- Spot prices eased significantly with the VWAP falling substantially to $93 / MWh from $148 / MWh the previous month, mostly due to a glut of renewables late in the month.
- Volatility remains in the SA market with 14 instances of pricing at -$999 / MWh and -$1,000 / MWh. There were no market caps, but there were two pricing events at$11,396 and $12,922 / MWh.
- Renewables generated 76% of the state’s energy mix. Wind power accounted for 47 percent of total generation, contributing 82 percent on Tuesday, October 4. Gas generation at 23% was the highest in the NEM. On Thursday 27 October, 94 percent of demand was met by renewables.
- Rooftop solar pushed South Australia’s minimum operational demand to a record low of 100 MW, beating its previous 2021 record by 4MW. AEMO estimated that behind-the-meter systems supplied 92% on 17 October at 1 pm.
The market trends last month largely followed September. After a false start, Loy Yang A finally returned to service in Victoria on October 31, but the effect will not be felt until November. Meanwhile, Callide C is still out of action, as is Kogan Creek in Queensland. At least renewables are picking up as the weather improves into spring.
COAG Ministers agreed that the major issue that needs to be addressed in Australia’s transition to renewable energy is the creation of a modern transmission network that can accommodate and accelerate renewable energy coming into the NEM.
With the new posture of COAG and the Federal Government, along with the Victorian Labor Party’s proposal to nationalise the energy sector, Australia’s NEM could be in for a massive overhaul in the coming years.
The markets are still nervous and jittery with the looming northern hemisphere winter likely driving anxiety over coal and gas prices. We are continuing to help our clients manage price volatility through a range of strategies.
We hope our October 2022 electricity market review has proven informative and insightful. For more context on the situation in the electricity market for the previous months, you may find our monthly energy market reviews here. Reach out to our energy experts to understand your options in these difficult conditions.
Explainer: Why we focus on Wholesale Futures Prices
Wholesale Futures Price: This is based on expectations of average future spot prices. If supply is expected to be tighter in the future, this will raise contract prices. The offers that commercial and industrial customers receive from Leading Edge Energy are wholesale futures prices reflected in kWh rather than MWh.
Spot Price: This represents how much the spot market is charging for electricity currently based on demand and supply. Spot prices go up when demand is high and supply is tight. You can view live Spot Prices here
Disclaimer: The information in this communication is for general information purposes only. It is not intended as financial or investment advice and should not be interpreted or relied upon as such.