As the world gathered in Glasgow for COP 26, the 2021 UN Climate Change Conference, the Morrison Government announced that it would commit Australia to Net Zero by 2050. Reaching this goal will require heavy decarbonisation of the electricity sector and plenty of evidence that this transition is well underway was on display throughout the October 2021 energy market. After another year of record installations, Australia now has the highest per capita installed solar capacity in the world at 810W per person and growing. A NEM-wide low operational demand record was set on October 3 only to be smashed by 7.5% two weeks later. Meanwhile, the NEM underwent two major market reforms positioning it to deal with the influx of variable supply. October opened with the long-planned introduction of a 5-minute settlement and closed with the Wholesale Demand Response Mechanism (WDRM) going live. Both initiatives increase market agility and facilitate increased renewable inputs. Check out our popular interactive market analysis tools to keep track of the changes and reach out to our energy experts for advice on how you can benefit during the transition.
| INDICATIVE RATES | NSW | QLD | VIC | SA |
| PEAK | 8.45 c/kWh | 7.06 c/kWh | 6.64 c/kWh | 6.93 c/kWh |
| OFF-PEAK | 5.48 c/kWh | 4.66 c/kWh | 3.78 c/kWh | 4.02 c/kWh |
New South Wales
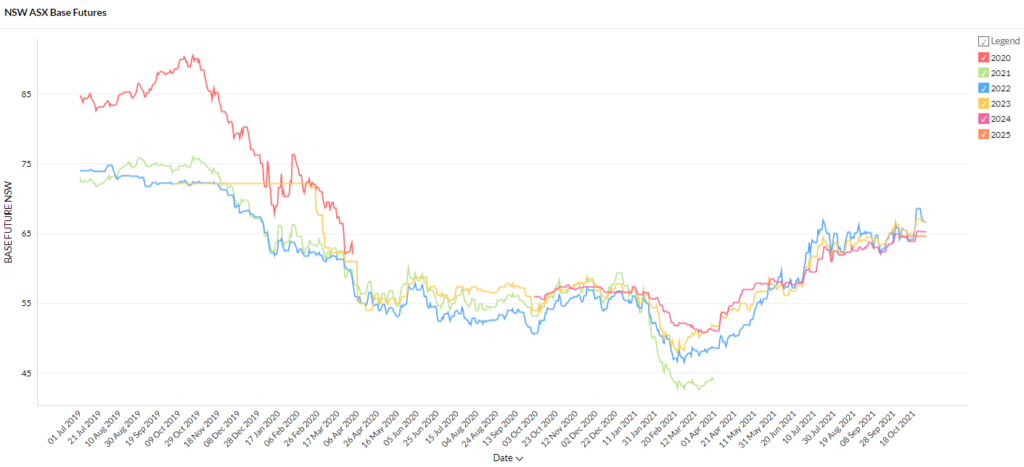
- Early contract years (2022 and 2023) are trading at ~$66.50/MWh. Both periods experienced a spike on 21 to 25 October before settling at around 1% up on the start of the month.
- 2024 prices also rose on 21 October and finished the month at $65/MWh.
- 2025 commenced trading at $65/MWh.
How did supply and demand affect price?
- The AEMO Quarterly Dynamics Report was released in October and it revealed that rooftop solar took another 1 GW of average demand from NSW coal generators in Q3 2021 compared to 2020 (in the middle of the day) with wind and grid-scale solar taking another 500 MW each.
- Unsurprisingly, NSW saw yet another low operational demand record set at 4,425 MWh at 1pm on 17 October. Operational demand is the demand that is left over after rooftop solar PV electricity is consumed “behind-the-meter”.
- Spot prices have been volatile with high prices in the evening as thermal generators struggle to climb the ever steepening tail end of the duck curve.
Victoria
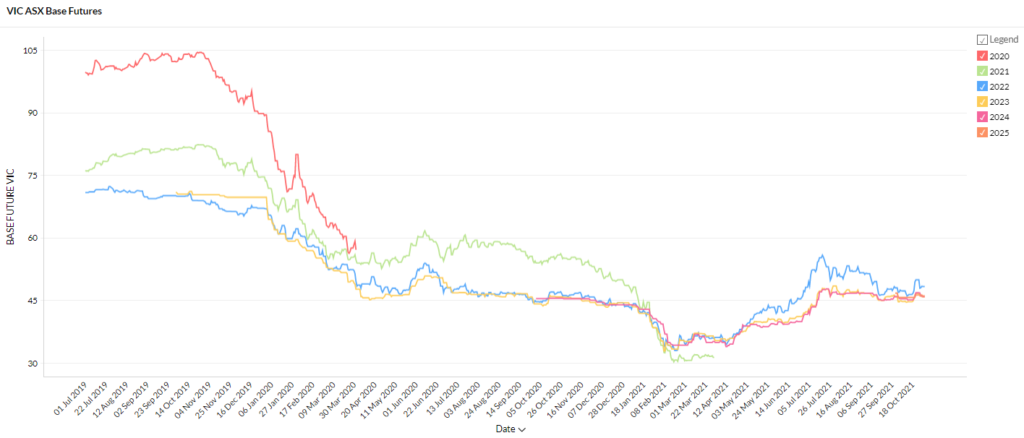
- Futures prices were volatile but ended only slightly up at the start of the month.
- 2022 prices spiked to $50/MWh for 5 days before falling back to ~$48/MWh.
- 2023, 2024 and 2025 are all trading around $46/MWh.
How did supply and demand affect price?
- Victoria was hit by severe storms at the end of October that left 500,000 people without power. The storms came as the Bureau of Meteorology issued a La Niña alert saying there was a 70% chance the system would develop.
- Victoria’s solar supply continues to surge with a report from AEMO finding that Victorian average spot prices between 10am and 3:30pm fell from $30/MWh in 2020 to just $0.01 a MWh in August and September.
- Victoria’s ‘big battery’ is undergoing testing as it prepares to come online following a major fire. It is the largest battery in Australia and will help manage the increasingly variable renewable supply in Victoria’s grid.
Queensland
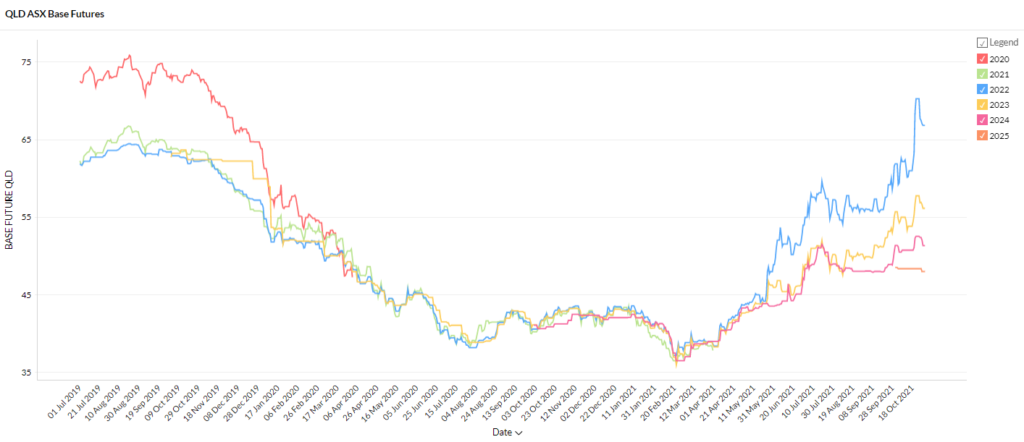
- Queensland’s futures contracts have soared up to 80% compared to the lows seen in February this year.
- 2022 has seen the steepest rise and is currently trading at $67/MWh after breaching the $70/MWh mark briefly on October 25. You could pick up 2022 contracted for as low as $37/MWh just 8 months ago.
- Contracts for later years get progressively cheaper with 2023 trading at $56/MWh, 2024 at $51/MWh and 2025 contracts available for $48/MWh.
How did supply and demand affect price?
- Spot prices were highly volatile, spanning the entire range from floor ( -$1,000/MWh) to ceiling ($15,000/MWh).
- Negative prices were driven by rooftop solar production forcing grid scale renewables and coal-fired plants to battle it out to supply the meagre remaining operational demand. Coal generators bid the price down -$1,000 to avoid the (expensive) hassle of shutting down while grid scale renewables were forced to cut output to avoid having to pay to generate.
- This dynamic will ease as increased storage and the aforementioned WDRM allow excess supply to be ‘soaked up’ for later use.
South Australia
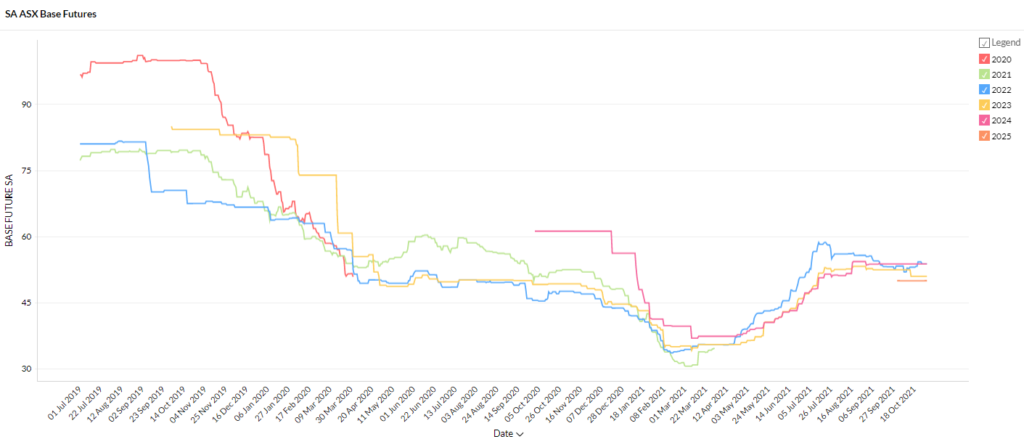
- South Australia bucked the trend of the other states in October 2021’s energy market and carved out its own (flat) path.
- Futures prices were remarkably stable with 2024 trading at $53.80/MWh for the entire month and 2025 sitting right on $50/MWh since the commencement of trading.
- 2023 contracts had one step change in price on October 15 shifting from $52.50/MWh to $51/MWh.
- Only 2022 showed any signs of life ranging from $52/MWh to $54.30/MWh throughout the month.
How did supply and demand affect price?
- Like Queensland, SA’s spot prices spanned the full allowable price range from -$1,000/MWh to $15,000/MWh throughout October.
- SA consistently saw the average spot price between 10am and 3:30pm at or below zero according to AEMO.
- The state’s vulnerability to gas prices was revealed when wind output fell on October 27 and prices spiked above $9,900/MWh for three five minute intervals as gas fired plants filled in the shortfall.
We head into summer with a Net Zero target, a newly structured electricity market, a La Niña alert and an expanded solar capacity that will really show us what it’s capable of in the coming months. Futures contracts have been heading up since February while spot prices are highly volatile. With so much to digest from the energy market this October 2021, we are here to help you develop an energy plan. Whether you are interested in how your business may be able to benefit from the new market mechanisms or you wish to protect against price volatility, reach out to our energy experts today.
Disclaimer: The information in this communication is for general information purposes only. It is not intended as financial or investment advice and should not be interpreted or relied upon as such.